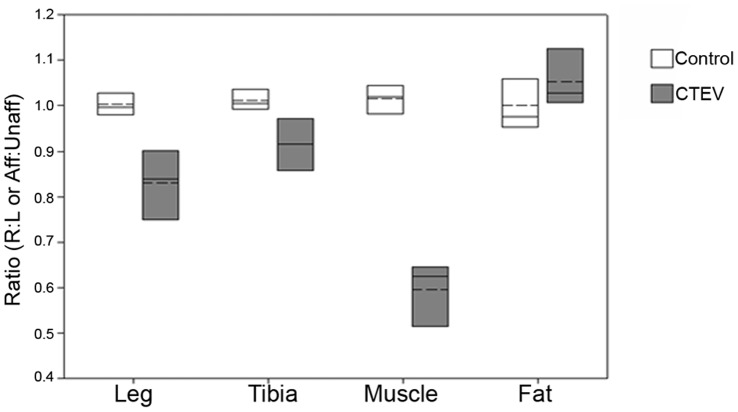
Figure 2. Right-to-left and affected-to-unaffected ratios of lower legs, tibias, muscles or subcutaneous fat volumes.
Ratio of right-to-left (R:L) volumes for controls (n = 5) (white). Affected-to-unaffected (Aff:Unaff) volumes for the unilateral CTEV group (n = 4) (grey). The mean (dashed line) and median (solid line) values are shown within boxes representing 25% and 75% limits.

