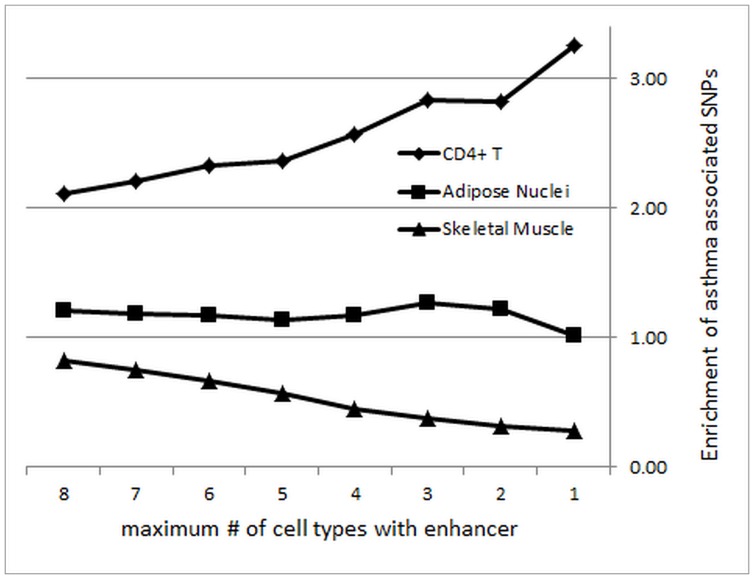
Figure 5. Distribution of enhancers in asthma-associated SNPs for different cell types.
Plotted is the enrichment of asthma-associated SNPs compared to background SNPs in genomic regions in which there are CD4+ T enhancers, and anywhere from –0 to 7 additional cell types that also have a peak in that region.

