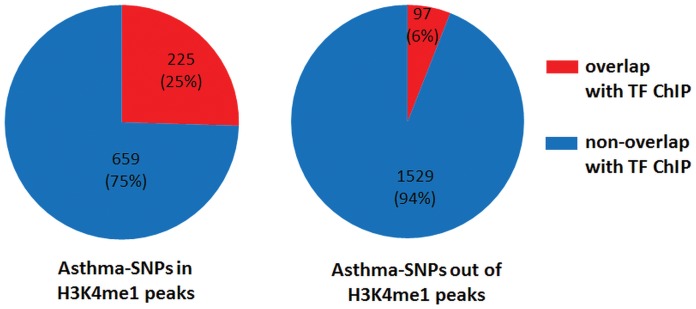
Figure 6. Distribution of the asthma-associated SNPs in TFBSs.
Two sets of asthma-associated SNPs are shown. Asthma-associated SNPs that belong to any of H3K4me1 peaks called in this study are shown on the left. On the right, the distribution of asthma-associated SNPs that are located in any of H3K4me1 peaks. The distribution of SNPs into overlapping and non-overlapping TFBSs was done using TFBSs by ChIP-seq dataset from the ENCODE (Release 2) [55]. The TFBSs ChIP-seq data were obtained from UCSC Genome Browser [34], [35].

