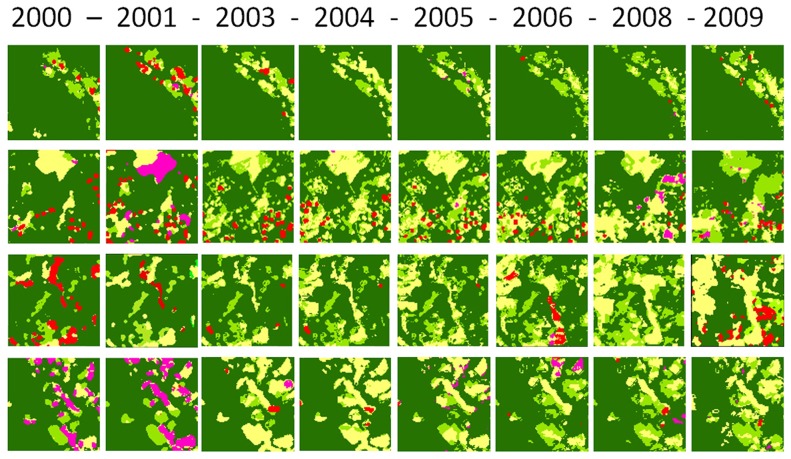
Figure 2. Land use changes during the period of analysis in four of the 291 windows (3 km×3 km), one of each mosaic type.
A, Forest mosaics; B, Pasture mosaics; C, Fire mosaics; and D, Illicit crop mosaics. Forest (dark green), secondary vegetation (light green); pastures (yellow), burned area (red); illicit crops (purple).

