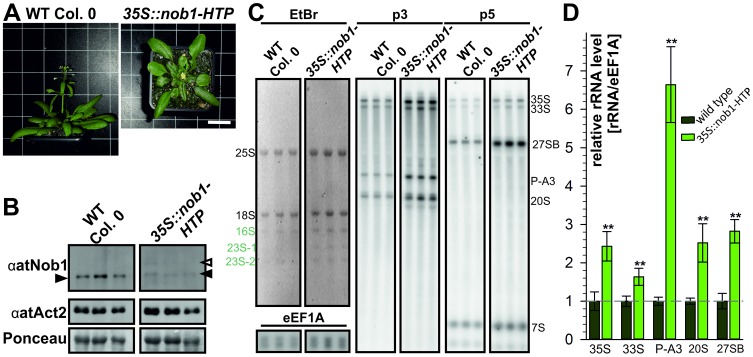
Figure 7. Analysis of co-suppression mutants of nob1.
A, To visualize the growth and flowering phenotype of wild type and nob1 co-suppression mutants two representative 30 day old plants are shown. Scale bar: 30 mm for both panels. B, For protein expression study of wild type and nob1 co-suppression mutants (upper panel) three independent wild type plants and three independent nob1 co-suppression mutants (independent transformation events) were used. As loading control αActin antibody (middle panel) and Ponceau staining (lower panel) are depicted. C, For northern blot analysis total RNA from leaves was loaded on a agarose gel. Three representative, independent plant lines are presented. EtBr staining of the gel is shown (left). As a loading control a probe against eEF1A was used. The migration of the pre-rRNAs is indicated on the right. D, The northern blot quantification of the major transcripts (35S, 33S, P-A3, 20S and 27SB) was normalized to the signal of eEF1A after background correction. For wild type three replicates were used. For the co-suppression mutants of nob1 six plant lines derived from four independent transformation events were used for quantification. To statistically analyze the changes of pre-rRNA values a Students’s t-test was performed. The two asterisk indicate a p-value below 0.005.

