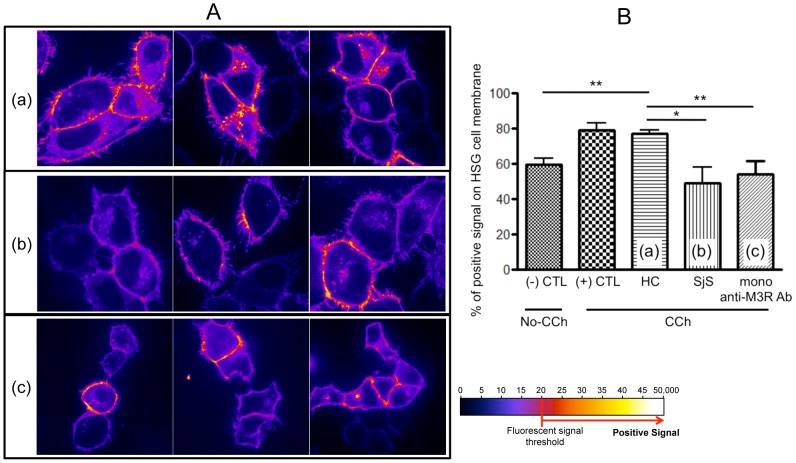
Figure 4. Inhibition of AQP5 trafficking to HSG cell plasma membrane by SjS plasma.
(A) rhAQP5 vector transfected HSG cells were pre-incubated with five different healthy control (HC, (a)), five SjS plasma (b), or mono-clonal anti-M3R antibody (c) for 24 hours (only three representative pictures are shown). rhAQP5 GFP signal trafficking in HSG cells after CCh treatment were acquired with a spinning disk confocal microscope with a 63X oil-immersion objective, using a cascade-cooled EMCCD camera. HSG cells were observed at 30-second intervals for 15 minutes with 1/250 second fixed exposure time. Representative still images were captured after 10 minutes and rhAQP5 signals were converted and analyzed by ImageJ software (1.46a, open source software, http://rsb.info.nih.gov/ij/). Pictures were converted into ‘Fire’ 3D LUT (lookup tables) setting in ImageJ software and only GFP signal above the fluorescent signal threshold (≥80, red or yellow color in converted picture), was considered for quantitative analysis (% of positive signal on the membrane) in (B) to compare rhAQP5 trafficking among CCh treated groups. Each column represents the mean ± SEM of 5, p value less than 0.05 was considered significantly different by two-tailed unpaired Student's t-test, **p<0.01.

