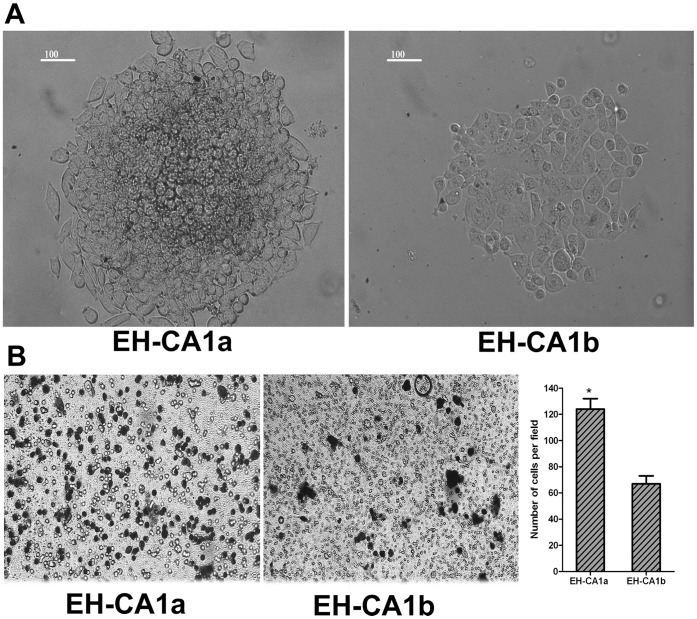
Figure 4. The colony formation and invasive potential of EH-CA1a cells and EH-CA1b cells.
(A). Colony formation of EH-CA1a and EH-CA1b. Standard soft-agar assays were performed on these cells. Both cells efficiently formed cell colonies in soft agar; however, the number and size of colonies formed by EH-CA1a cells were much higher than EH-CA1b cells. (B) Invasive potential of EH-CA1a and EH-CA1b. The phase-contrast images of the invasion assay (left) showed that much more EH-CA1a cells were passed through the matrigel than EH-CA1b cells. Results represent means ± standard deviations from three independent experiments (*P<0.05).

