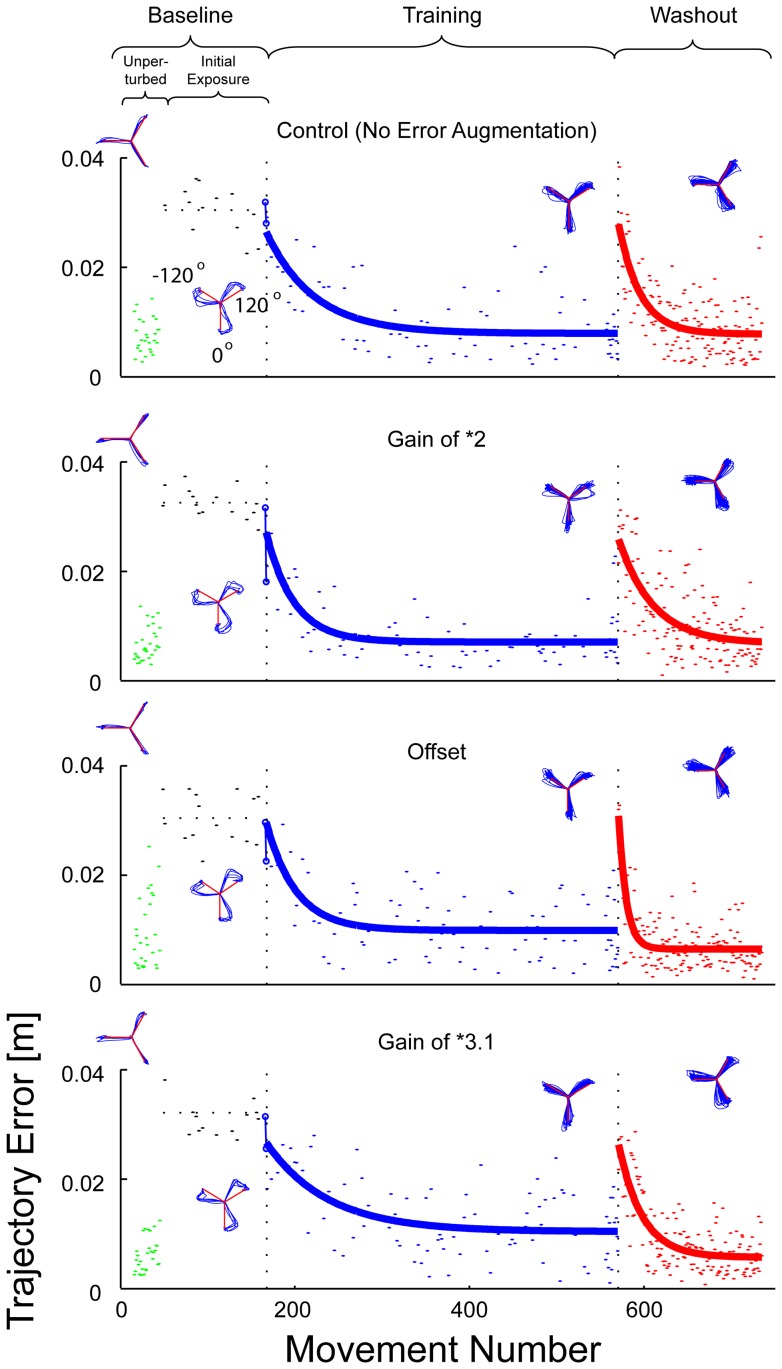
Figure 2. Representative trajectories and learning curves for representative subjects in each group.
Each row of plots displays data from a typical subject from each group for the successive phases of the experiment. The insets above each curve show typical movement paths where red lines indicate the path the subjects should have reached to successfully complete the task. Learning and washout phases were each fit to exponential curves (bold blue and red lines). While the training conditions differed for each group, the catch-trials used to fit these curves were performed under identical conditions for all groups (30° rotation with no error augmentation). These random and intermittent catch trials occurred at the same movement number for all groups. Initial error reduction after the first exposure to the distortion is shown as a blue line segment connecting encircled trials.

