
Figure 3. Group results of the curve fitting for all subjects in the four groups according to Eq. 1.
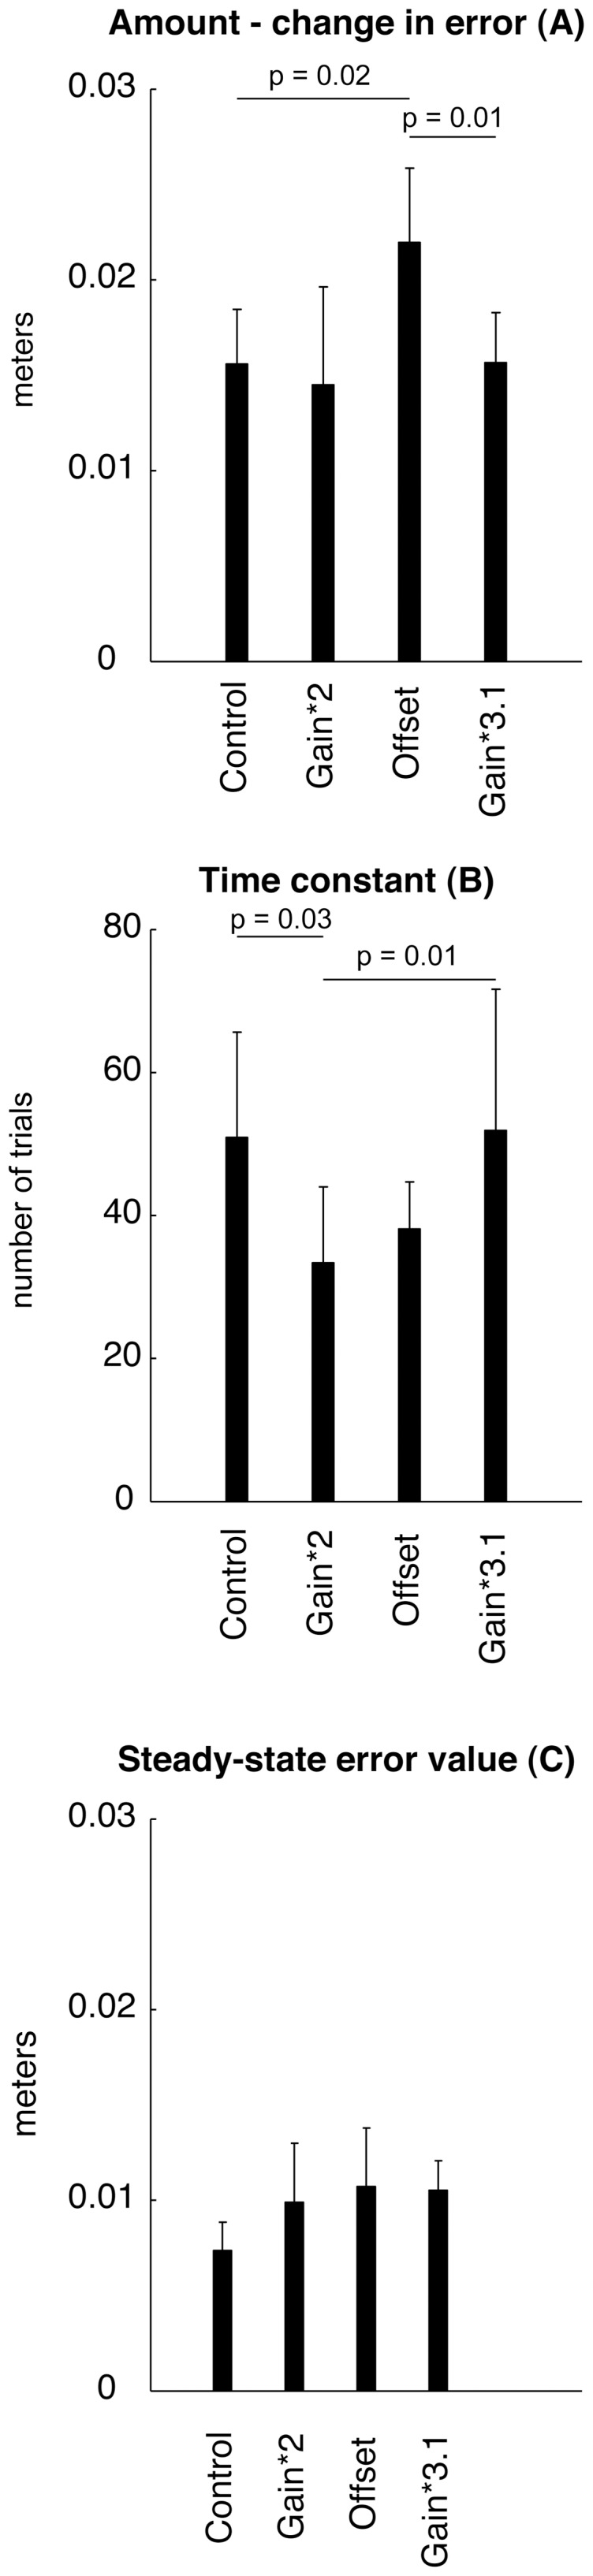
The amount of learning (parameter A, top), time constant of error decay during learning (parameter B, middle) and steady state value (parameter C, bottom) are shown. Error bars indicate 95% confidence intervals. Horizontal lines indicate significant differences (post-hoc) between groups.