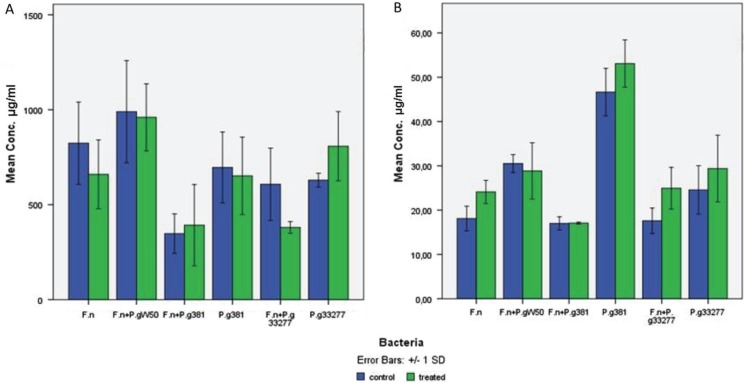
Fig. 3.
Comparison of (A) carbohydrate and (B) eDNA yields from the biofilm matrix samples treated with proteinase K enzyme and non-treated samples. The matrix of 5-day-old biofilm was treated with 5 µg/ml proteinase K at 37°C for 1 h. F.n, Fusobacterium nucleatum ATCC 2558; P.g W50, Porphyromonas gingivalis W50; P.g 381, P. gingivalis FDC381; P.g 33277, P. gingivalis ATCC 33277. The bars represent the means with standard deviations from five samples (carbohydrates) and three replicates (eDNA).

