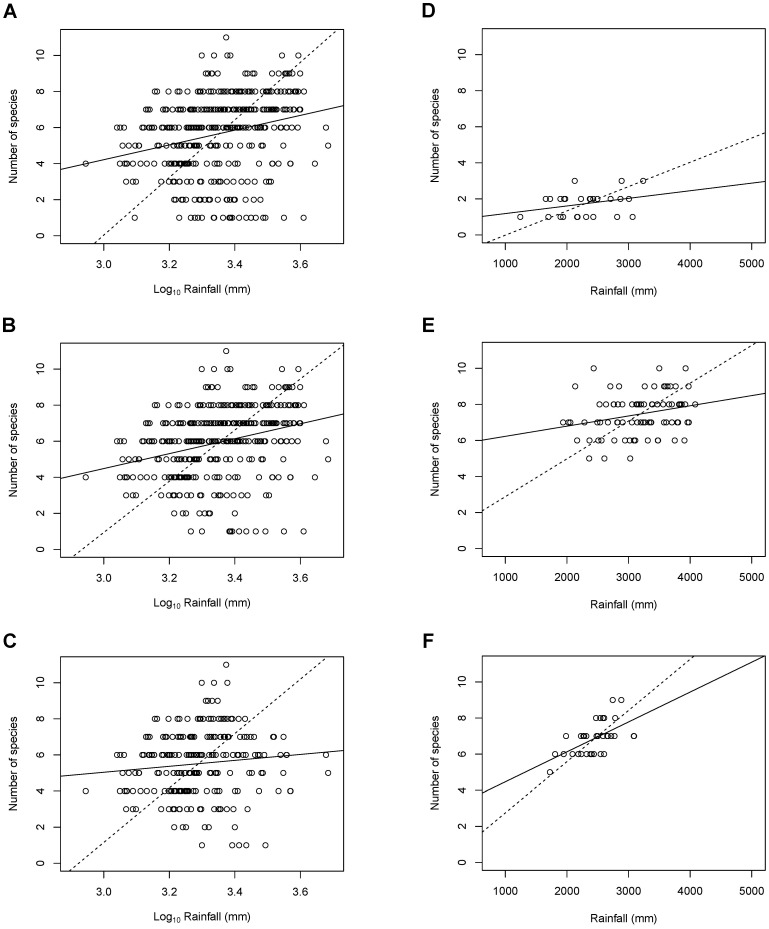
Figure 2. Primate species richness as a function of rainfall for (A) Southeast Asia; (B) Huxley West; (C) Mainland Southeast Asia; (D) Huxley East; (E) Borneo; and (F) Sumatra.
Note that log-transformed rainfall data are used for (A) to (C) because the data of these three regions are not normally distributed. For comparison purpose, the ranges for all the y-axes are fixed; the rainfall range in the x-axis for (A) to (C) is approximately the same as that for (D) to (E) after log-transformed. The dash and solid fitted trend lines are based on the reduced major axis and the ordinary least squares regressions, respectively.

