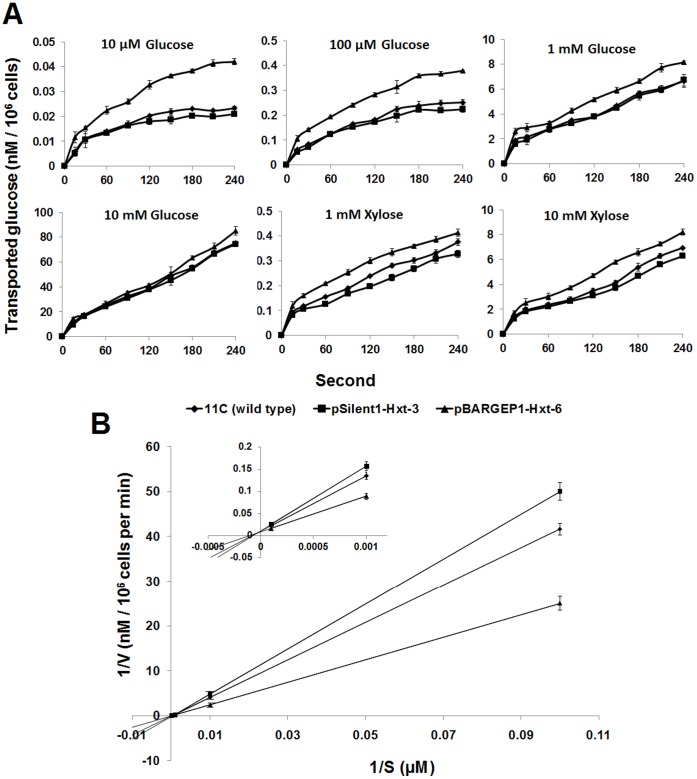
Figure 7. Kinetics of glucose uptake by wild type Fusarium oxysporum strain 11C, overexpression mutant pBARGPE1-Hxt-6 and PTGS mutant pSilent1-Hxt-3.
(A) Uptake of D-glucose and D-xylose (nM of glucose/xylose transported per 106 cells) by F. oxysporum. The amount of sugar used in each transport assay is indicated above each graph. Uptake was measured as described by Jørgensen et al. [58]. Results are based on two experiments, each with three replicates per strain/mutant per medium. Bars indicate the SEM. (B) Double-reciprocal plots were plotted to deduce the Km(glucose) and Vmax values for the F. oxysporum hexose transporter (Hxt). The inset is an amplification of the 1/S values from 0 to 0.001 µM. S, Substrate concentration (µM); V, velocity (nM/106 cells per min). Bars indicate SEM.

