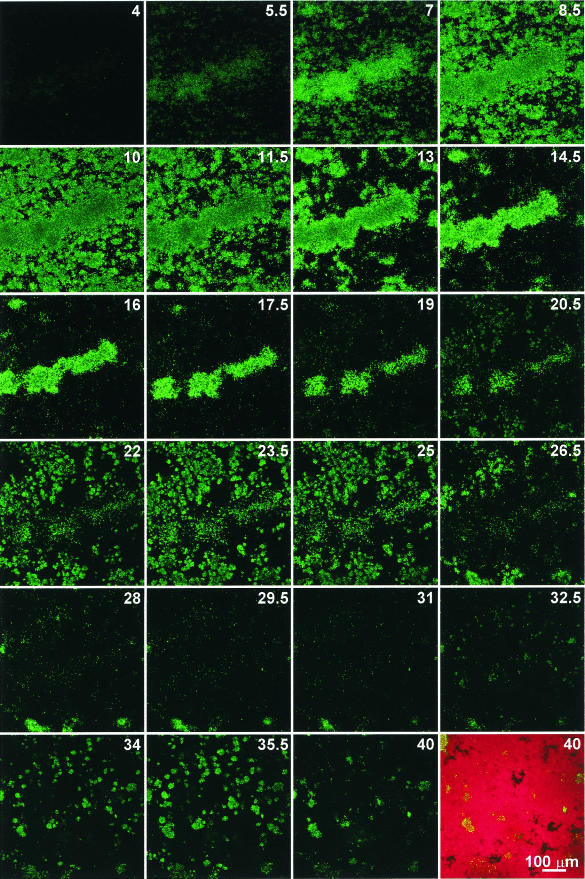
FIG. 4.
Time lapse expression of the agr P3-gfp reporter in a flow cell biofilm of S. aureus MN8(pDB22). The images were acquired at 15-min intervals by using identical CSLM settings with a 20× objective lens. Sequential images taken every 90 min are shown, with the number of hours postinoculation indicated. The final image (40 h postinoculation) is shown before and after treatment with SYTO62. The images represent a compressed z series, where multiple x-y planes from top to bottom of the biofilm are combined.

