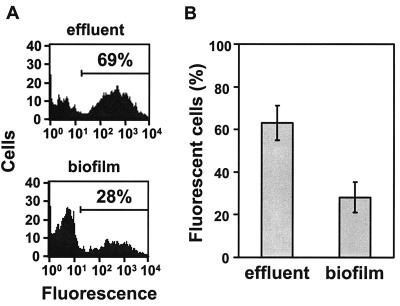
FIG. 6.
Expression of the agr P3-gfp reporter in flow cell biofilms and effluents after 60 h. Effluents were collected for ∼30 min from flow cells. Biofilms were then expelled from the same flow cells described in Materials and Methods. All collected cells were subsequently dispersed by ultrasonication and analyzed by flow cytometry for fluorescence (FL-1 channel). (A) Flow cytometry results from one representative flow cell biofilm and its effluent. The percentages represent the cells that fell within the range of fluorescence delineated by the marker. (B) Percentages of cells from quadruplicate flow cell biofilms and their effluents that were green fluorescent ± the standard deviation. The data are significant (P < 0.001; Student t test).

