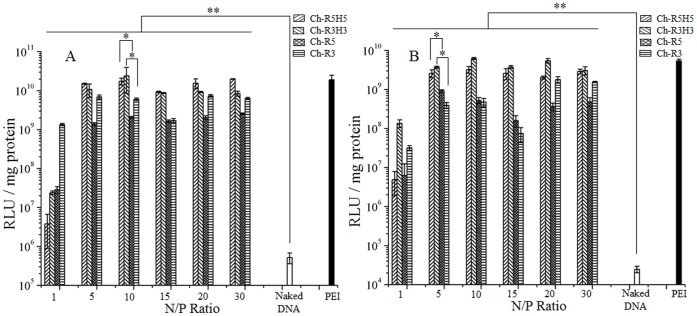
Figure 4. Luciferase expression levels induced by Ch-R5H5/DNA, Ch-R3H3/DNA, Ch-R5, and Ch-R3 complexes in mammalian cells.
DNA and PEI/DNA complex at an N/P ratio of 10 are used as negative and positive controls respectively. Error bars represent standard deviation of 4 replicates. Panel A. HEK-293 cell line. Panel B. MCF-7 cell line.

