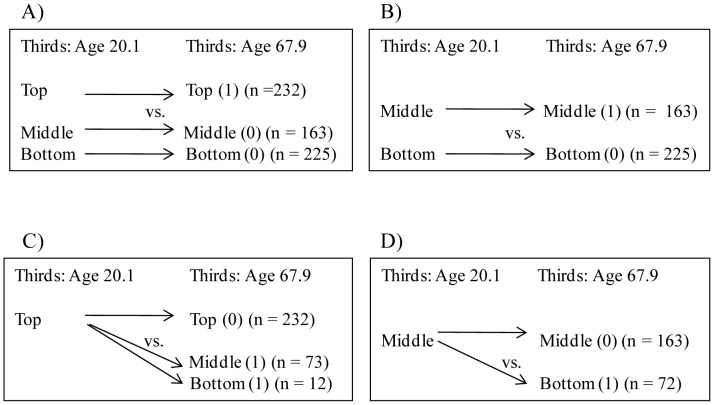
Figure 1. Schematic illustration of logistic regression analyses of cognitive development after age 20.1 years.
Schematic illustration of logistic regression analyses comparing men who remained in the top, middle and bottom thirds (panels A and B) and who declined from the top and middle thirds in cognitive ability after age 20.1 years (panels C and D).

