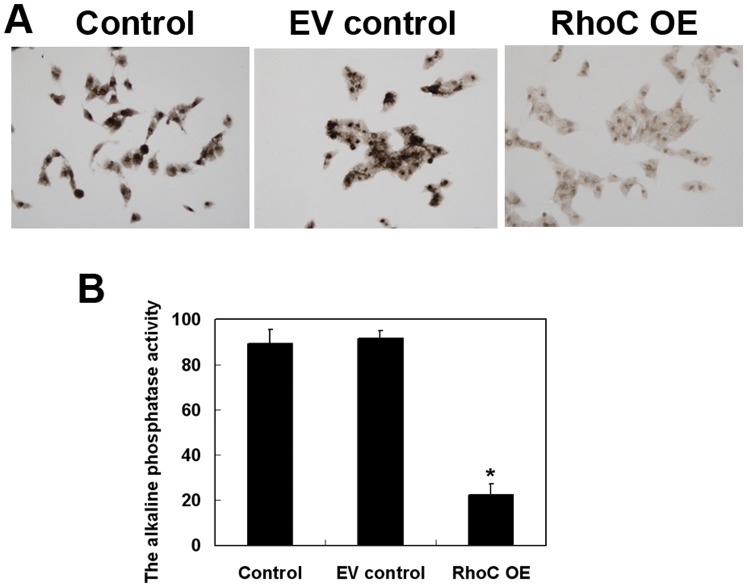
Figure 4. Effects of RhoC overexpression on the suppression of HL7702 cell differentiation.
(A) Alkaline phosphatase staining (magnification, ×400). (B) Quantitative data. The alkaline phosphatase activity was determined and averaged from at least three randomly selected samples in each group. *P<0.05 compared with EV control.

