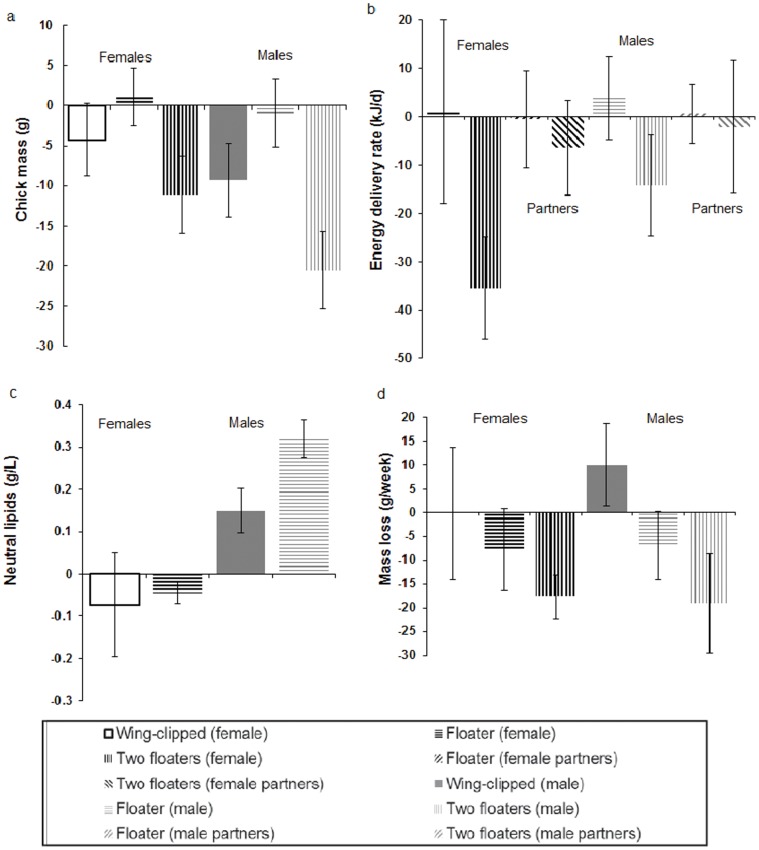
Figure 1. The effects of floaters and wing clipping of breeding Thick-billed Murres.
a. Residual on chick age of chick mass, relative to residuals at the start of the experiment; b. Energy delivery rates, c. Plasma neutral lipids at six days and d. mass loss per week of parental thick-billed murres at Coats Island 2003–2005. All values are shown relative to control birds (average for experimental birds across all individuals – average for control birds across all individuals with the same sex) and SE bars include total SET propagated from control SEC and experimental SEE using SET 2 = SEC 2+ SEE 2. Statistical results are shown in Table 3. Females shown in black and white (left side of each graph); males shown in grey and white (right side of each graph).

