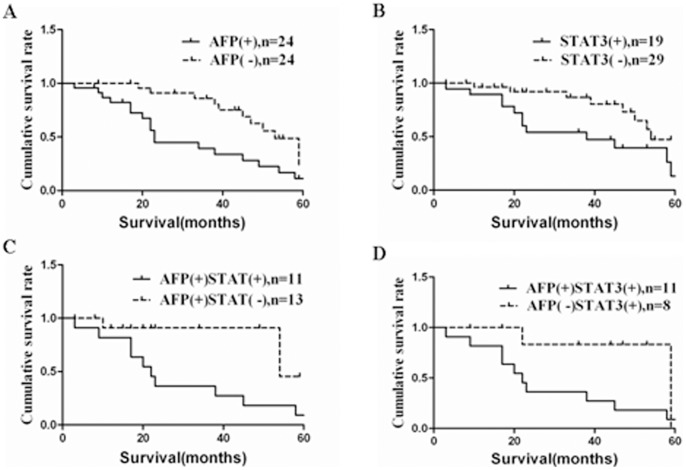
Figure 6. Kaplan–Meier survival curves and log-rank test for patients with AFP-positive gastric cancer (AFPGC) stratified by AFP and STAT3 expression.
(A) AFP positivity alone. (B) STAT3 positivity alone. (C) AFP and STAT3 double positivity compared with AFP positivity. (D) AFP and STAT3 double positivity compared with STAT3 positivity(all P<0.05).

