
Figure 2. Hydrolysis of L-DNA1 by an L-Hammerhead Ribozyme and D-DNA1 by a D-Hammerhead Ribozyme at various Mg++ Concentrations.
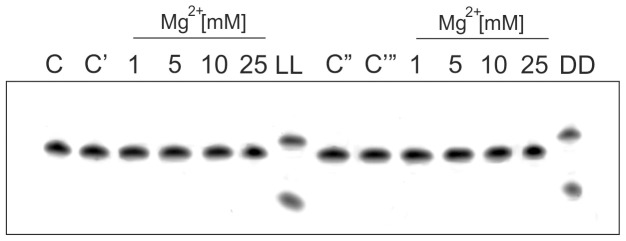
Left panel: Target L-DNA1 in buffer without MgCl2 (C), the same with 25 mM of MgCl2 (C’), Target L-DNA1 with a hammerhead Spiegelzyme at 1, 5, 10 and 25 mM MgCl2, LL control: L-RNA1 incubated with L-hammerhead. Right panel: Target D-DNA1 in buffer without (C’’) and with 25 mM MgCl2 (C’’’). Target D-DNA1 and hammerhead ribozyme at 1, 5, 10 and 25 mM MgCl2, DD control: D- RNA1 incubated with D-hammerhead ribozyme. Arrow identifies hydrolysis site as in Fig. 1B.