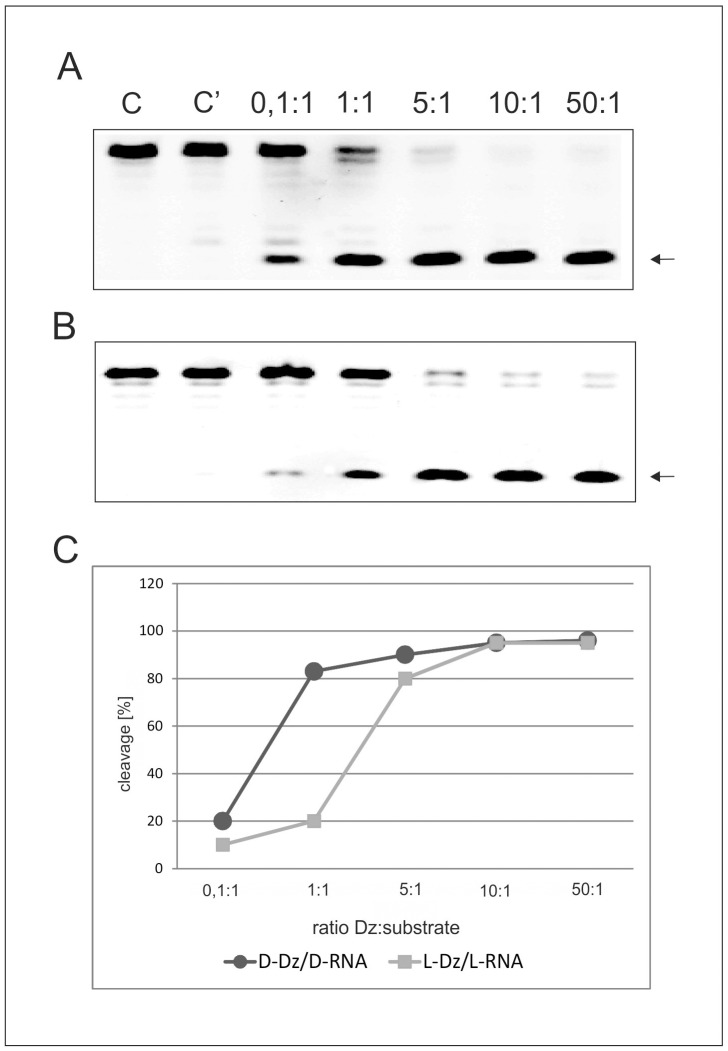
Figure 7. Hydrolysis of D- or L-RNA2 at different D- or L- DNAzyme ratios.
Panel (A) D-DNAzyme hydrolysis of D-RNA2 at enzyme to substrate ratios as indicated in the lanes of the figure. Lane C: D-RNA2 incubated only in buffer, lane C’: D-RNA2 incubated in buffer with 10 mM MgCl2. Panel (B) L-DNAzyme hydrolysis of L-RNA2 at enzyme to substrate ratios as indicated in the lanes of the figure. Lane C: L-RNA2 incubated only in buffer, lane C’: L-RNA2 incubated in buffer with 10 mM MgCl2. (C) D-DNAzyme hydrolysis of D-RNA2 (black circles) at enzyme to substrate ratios as indicated in the figure and L-DNAzyme hydrolysis of L-RNA2 (gray squares) at ribozyme to substrate ratios shown in the panel. Incubation periods 3 h for all other conditions see Materials and Methods.

