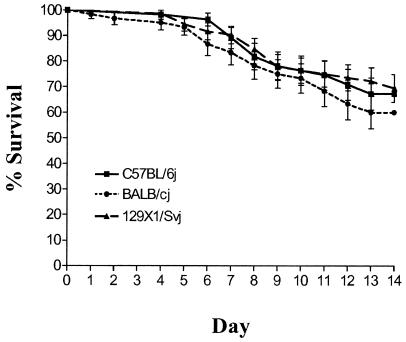
FIG. 1.
LD50 analysis. Survival curves for three strains of mice over a 14-day period are shown. Survival percentages were calculated using the Kaplan-Meier method (1). Six groups of five or six mice from each genetic background were infected orally with successive 10-fold dilutions of the bacterial suspension (104 to 109 bacteria) and monitored twice daily for 14 days. The analysis was done in duplicate in two independent experiments.

