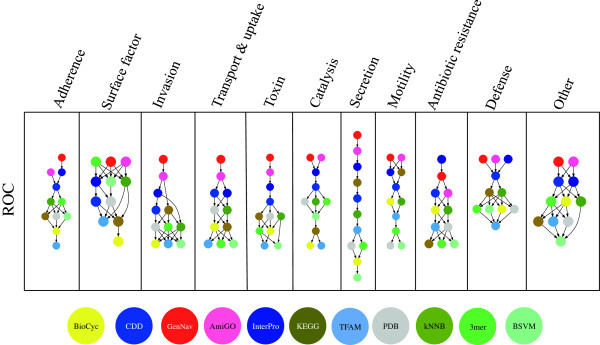
Figure 3.

Specific ROC comparisons. Statistical significances based on six five-fold cross-validations for all 11 virulence classes. An arrow from a head source or method to a tail source or method transitively indicates better pairwise performance from the head against the tail. Results, via two- tailed t-test, for area under the ROC are shown and nodes are color-coded based on source type (blue indicates domain- or motif-based sources, red GO term-based sources, yellow- brown for pathways, gray for structural sources and green for baseline methods).
