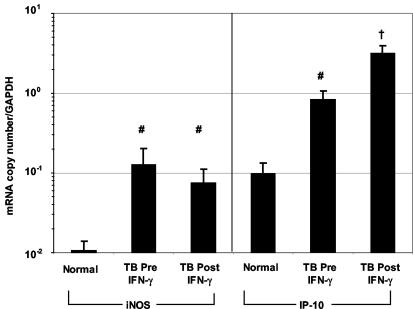
FIG. 3.
iNOS and IP-10 mRNA levels in vivo measured by real-time quantitative PCR. iNOS (left) and IP-10 (right) expression was measured by quantitative PCR using molecular beacons in mRNA from BAL cells. Data are from 17 of 21 TB patients and 8 of 10 patients who received IFN-γ. Values were corrected for GAPDH gene expression and are expressed as means ± SEM. iNOS and IP-10 mRNA levels were higher in TB patients than in normal volunteers (#, P ≤ 0.03), and IP-10 was increased further post-IFN-γ treatment (Post IFN-γ) (†, P ≤ 0.01 compared to normal and TB pre-IFN-γ treatment [Pre IFN-γ] results).

