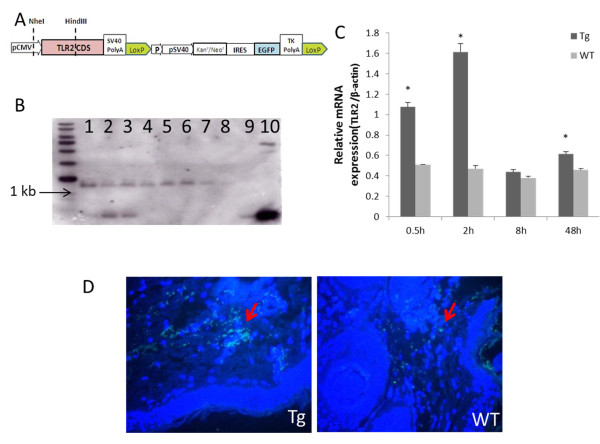
Figure 1.
Transgenic goats over-expressing Capra hircus TLR2. (A) Structure of p3S-LoxP-TLR2 plasmids. (B) Southern blotting analysis, 1–3: positive samples; 4–7: negative samples; 8: control; 9, 10: p3S-Loxp-TLR2 plasmid. (C) Relative quantitative analysis of TLR2 mRNA expression under Pam3CSK4 stimulation. (D) Immunohistochemical study of TLR2 protein product: transgenic (Tg) group, wild-type (WT) group. Sections were double-stained with DAPI (blue) and TLR2-FITC (green).

