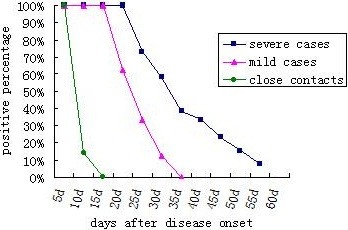
Figure 1.

The comparison of EV71 excretion among three paediatric groups (close contact group, mild case group, severe case group). Solid square represents positive rates of the samples from severe case group at a certain day. Solid triangle represents positive rates of the samples from mild case group at a certain day. Solid circle represents positive rates of the samples from close contact group at a certain day.
