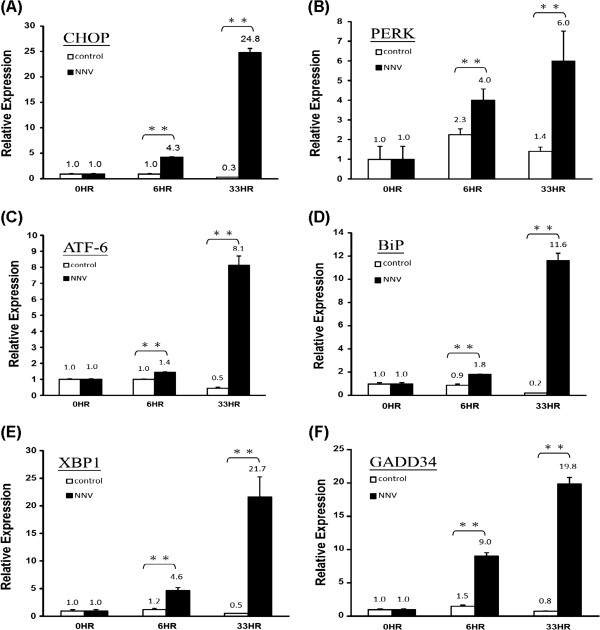
Figure 3.
Expression of CHOP, PERK, ATF6, BiP, XBP1 and GADD34 in NNV-infected GK cells. GK cells were infected with NNV at MOI of 10, and harvested at 6 and 33 hr post-infection. Triplicate samples were collected. The expression level of CHOP, PERK, ATF6, BiP, XBP1 and GADD34 was measured by quantitative RT-PCR, and the relative expression of each gene was normalized against the expression level of β-actin. The average relative expression of each set of sample is indicated by the numbers above bars. The significance of difference was analyzed by Student’s t-test (*0.01 ≤ p ≤ 0.05; **p ≤ 0.01). Vertical bars represent the standard deviation (n = 3).

