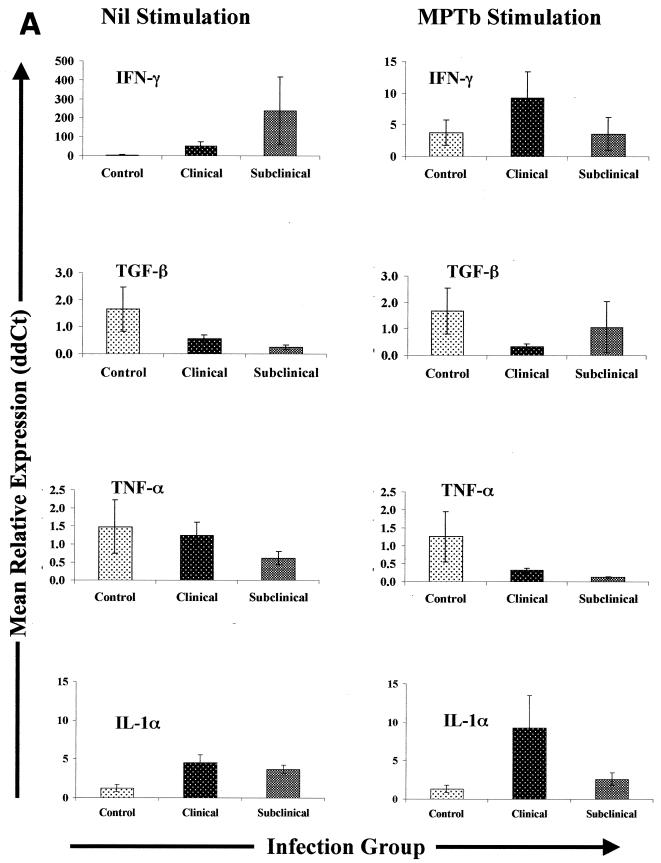
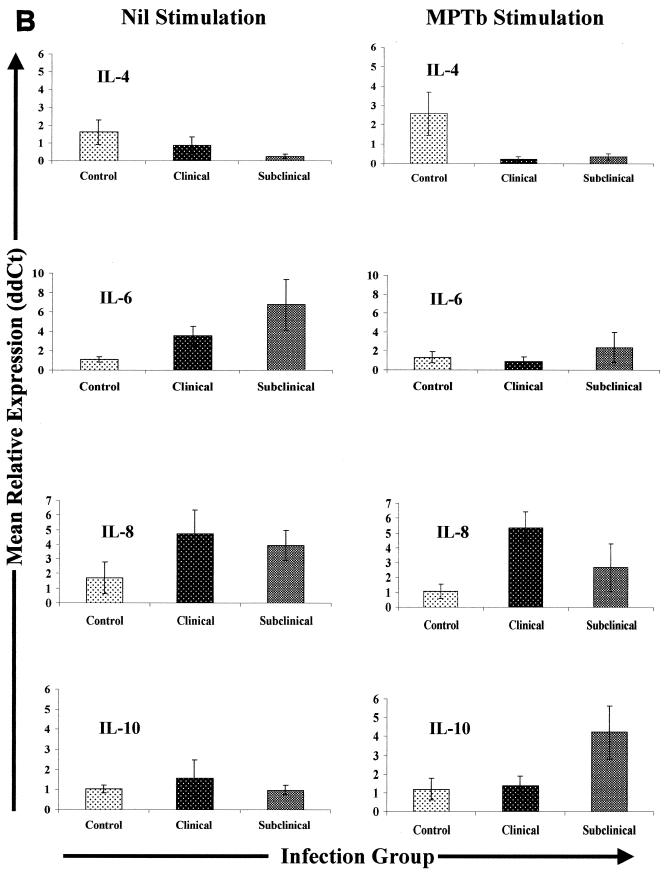
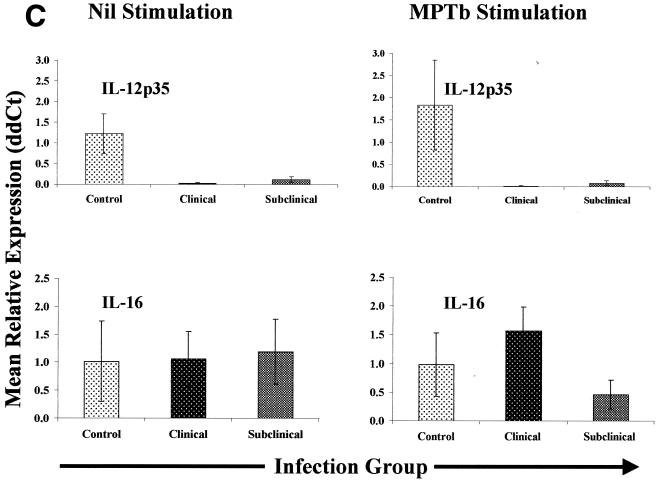
FIG. 3.
Cytokine gene expression in PBMCs from Johne's disease-positive and control cows. PBMCs were isolated and stimulated with either PBS (Nil) or M. avium subsp. paratuberculosis (MPTb) as described in Materials and Methods. RNA isolation and Q-RT-PCR were performedas described in Materials and Methods. Q-RT-PCR data were analyzed by using the 2−(ΔΔCt) method, with β-actin gene expression serving as a control for calculation of ΔCt values for each gene and the mean control value for each stimulation serving as the calibrator for final calculation of mean relative expression values (ddCt). Because the largest differences were observed between groups, data are presented so that they highlight between-group gene expression differences for each type of stimulation (nil or M. avium subsp. paratuberculosis). Likewise, data for each group of infected cows (subclinically infected and clinically infected) are displayed separately due to the significant differences (P > 0.05) in expression of some cytokine genes.


