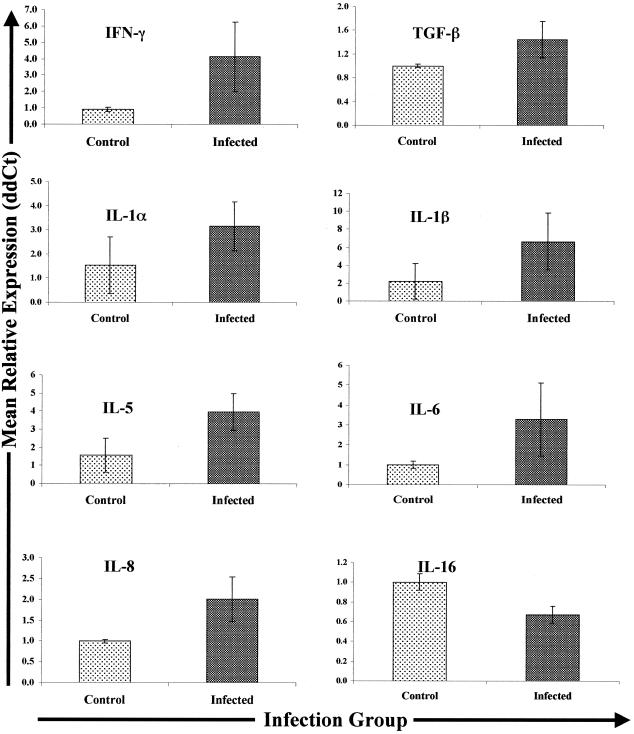
FIG. 4.
Cytokine gene expression in ileal tissues from Johne's disease-positive and control cows. Tissues were collected, RNA was extracted, and Q-RT-PCR was performed as described in Materials and Methods. Q-RT-PCR data were analyzed by using the 2−(ΔΔCt) method, with β-actin gene expression serving as the control for calculation of ΔCt values for each gene within animal and the mean control value for each gene serving as the calibrator for final calculation of the mean relative expression values (ddCt). Only data for the genes exhibiting differential expression in the different infection groups (infected and control) are shown.

