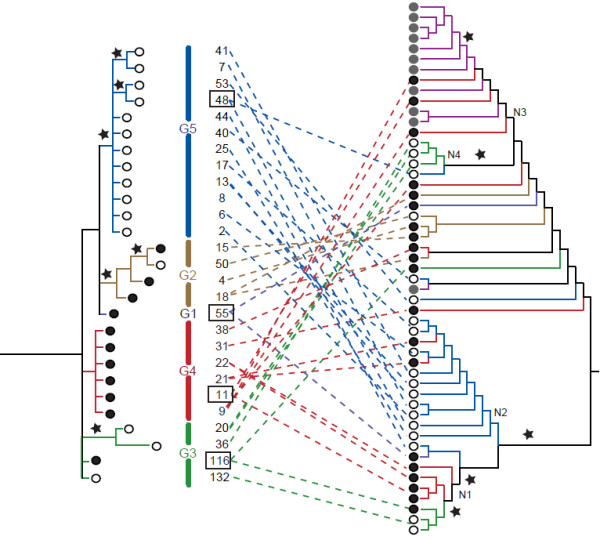
Figure 5.
Reticulate pattern observed by comparing the phylogeny obtained using the cpDNA (left) and PgiC (right). Comparison based on the independent analyses of the cpDNA excluding Nyingchi Platygyria and PgiC data including Nyingchi Platygryia (for comparison see Figures 1 and 2). Numbers correspond to voucher numbers given in Additional file 1. Dotted lines connect cpDNA and PgiC copies of each specimen. Circles indicate the kind of sporangium: filled black circles = indehiscent sporangium with L. clathratus cpDNA, filled grey circles = indehiscent sporangium with non L. clathratus cpDNA (= Nyingchi Platygyria), open circles = dehiscent sporangium with L. clathratus cpDNA. Colors are chosen to visualize the correspondence of haplotype groups, G1-G5 as defined in Wang et al. [22] and PgiC copies. Squares indicate specimens with PgiC sequences belonging to highly divergent clades. Stars indicate the Bayesian inference P-values ≥ 0.95.

