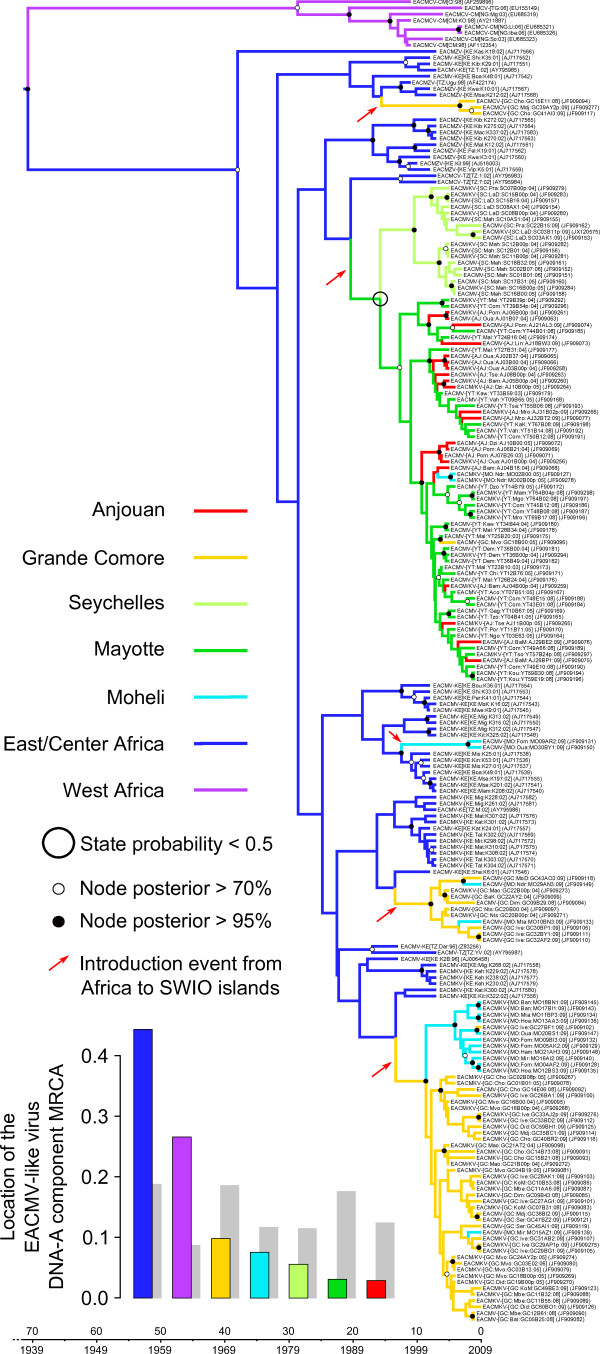
Figure 2.
Maximum clade credibility trees constructed from the EACMV-like capsid protein (CP) dataset. Branches are coloured according to the most probable location state of the node on their right (i.e. the likely geographical location of the ancestral sequence represented by this node). The large black circle around one of the nodes indicates that the state probability at this node is less than 0.5 (i.e. there is less than 50% confidence in the indicated location being the actual place where this ancestral sequence existed). The time-scale of evolutionary changes represented in the tree is indicated by the scale bar below it. Whereas filled circles associated with nodes indicate > 95% posterior probability support for the branches to their left, open circles indicate nodes with > 70% posterior support for these branches. Nodes to the right of branches with < 70% support are left unlabelled. The bar graph on the left corner indicates location probabilities of the node at the root of the tree (which is the node representing the last common ancestor of all the sequences represented in the tree). Grey bars represent the probabilities obtained with randomisation of the tip locations. Probable introduction events from Africa to the SWIO islands are indicated with red arrows.

