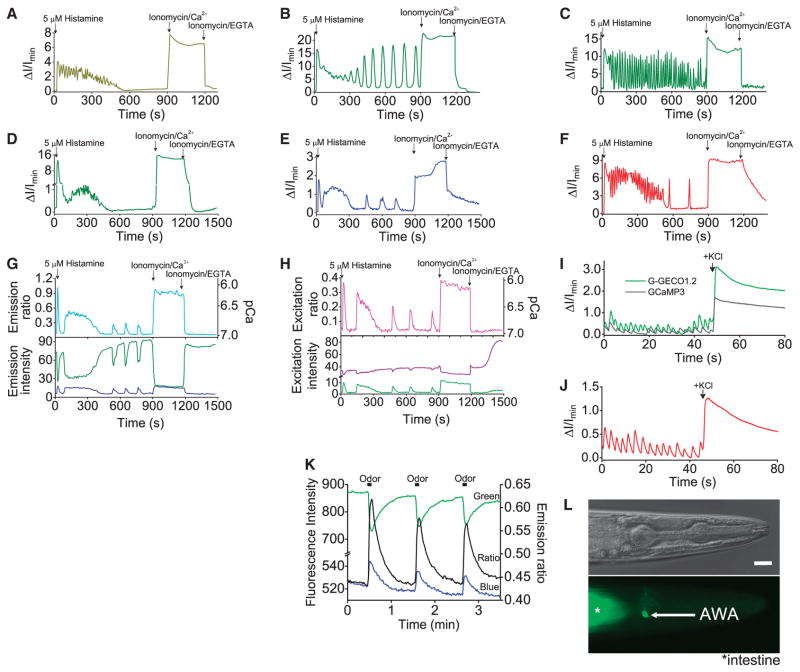
Fig. 3.
Single-color imaging with GECOs. (A to H) Intensity versus time traces for transfected HeLa cells. (A) GCaMP3, (B) G-GECO1, (C) G-GECO1.1, (D) G-GECO1.2, (E) B-GECO1, (F) R-GECO1, (G) GEM-GECO1, and (H) GEX-GECO1. Ionomycin/Ca2+, ionomycin/EGTA, and the initial histamine-induced spike are generally consistent for a given variant (table S4), but the histamine-induced oscillations are highly variable between cells. Accordingly, lower-amplitude oscillations [e.g., (A) and (D)] do not necessarily indicate poorer indicator performance. (I) Imaging of spontaneous Ca2+ oscillations in neurons. (J) R-GECO1 imaged under conditions similar to those in (I). (K) Ratiometric imaging of C. elegans with GEM-GECO1 expressed in the AWA neuron. (L) Bright-field and fluorescence images of the worm imaged in (K). Scale bar, 10 μm. Filter specifications are in table S5.

