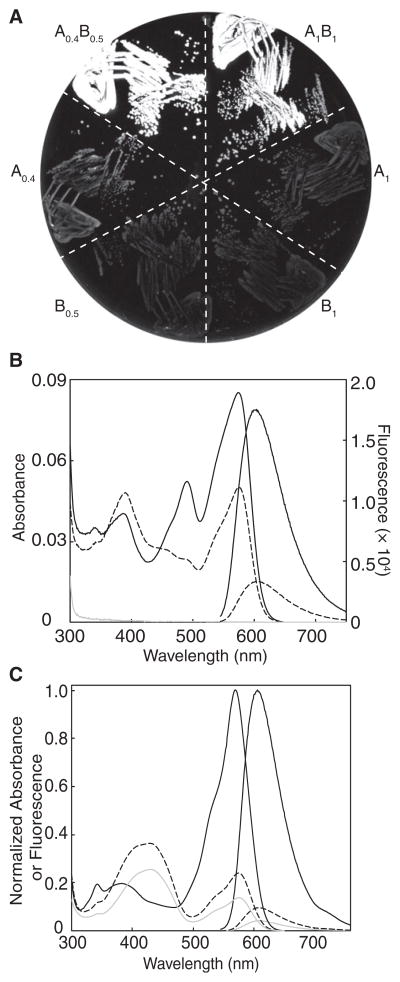
Figure 4. Characterization of ddRFPs.
(A) Fluorescence image of E. coli expressing various proteins discussed in the text. A0.4B0.5 and A1B1 are tandem constructs.
(B) Absorbance and fluorescence emission spectra for A0.4 (dashed line; 10 μM), B0.5 (gray line; 10 μM), and the equimolar mixture of A0.4 and B0.5 (black line; 10 μM each).
(C) Absorbance and fluorescence spectra of A1 (gray line; 20 μM) and tandem ddRFP-A1B1 (black line; 20 μM) before (solid line) and after (dashed line) treatment with trypsin. B1 has baseline absorbance and fluorescence. See also Figure S3.

