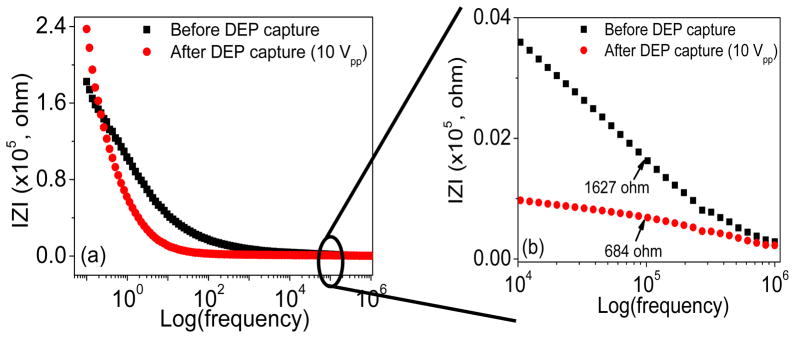
Figure 5.

Variation of the electrochemical impedance spectroscopy (EIS) before and after bacterial cell capture. (a) The Bode plot of the EIS, that is the amplitude of |Z| vs. the logarithm of the AC frequency, recorded in an E. coli cell suspension in deionized water before and after subjected to DEP capture at the exposed CNF tips by applying an AC potential of 10 Vpp at 100 kHz frequency. (b) An enlarged portion of the Bode plot to show impedance change at the frequency around 100 kHz in an E. coli cell suspension before and after subjected to DEP capture at the CNF NEA.
