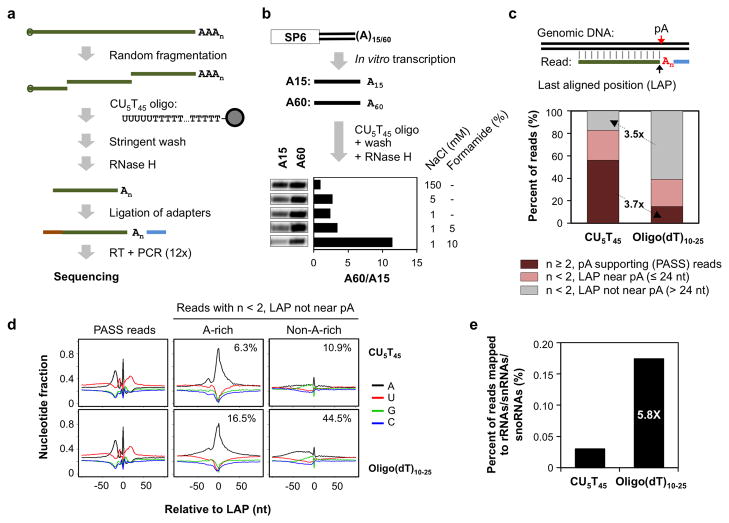
Figure 1. Mapping pAs by 3′READS.
(a) Schematic of the 3′READS method. See Methods for detail. (b) Optimization of washing condition to enrich RNAs with long poly(A) tails. Radioactively labeled A15 and A60 RNAs were synthesized by in vitro transcription using SP6 RNA polymerase. The X-ray film image shows the eluted RNA after RNase H digestion. The A60/A15 ratio indicates the difference in amount between eluted A60 and A15 RNAs. (c) Reads generated by 3′READS using the CU5T45 oligo or oligo(dT)10–25 (See Methods for detail). Top, schematic showing alignment of a read to genomic DNA. The last aligned position (LAP) and the putative pA are indicated by arrows. Bottom, distribution of three types of reads: 1) reads with ≥ 2 As immediately downstream of the LAP, which were used for pA identification and were called polyA site supporting (PASS) reads; 2) reads with <2 As immediately downstream of the LAP, and the LAP is near a pA (≤ 24 nt); 3) same as 2) except that the LAP is not near a pA (> 24 nt). (d) Nucleotide profiles around the LAP (set to position 0), as illustrated in (c). Top panels are reads generated by CU5T45 and bottom ones by oligo(dT)10–25. Left, PASS reads; middle and right, reads with <2 As immediately downstream of the LAP and the LAP is not near a pA, i.e., type 3 in (c). Reads whose LAP is flanked by A-rich sequences (middle) or non-A-rich sequences (right) areshown. The percent of total reads is shown in each graph. An A-rich sequence is defined as ≥6 consecutive As or ≥7 As in a 10 nt window in the −10 to +10 nt region around the LAP. (e) Percent of PASS reads assigned to rRNA, snoRNA, and snRNA genes for data generated by CU5T45 or oligo(dT)10–25. The ratio of the values is indicated.

