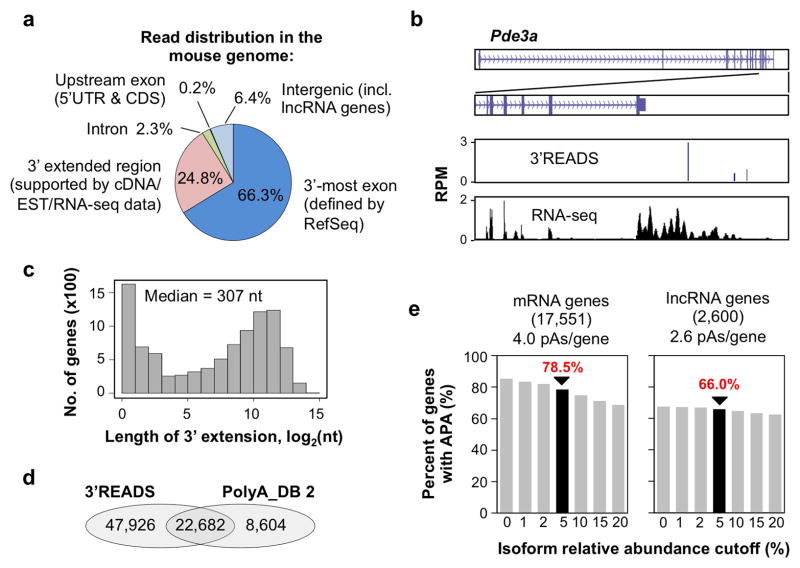
Figure 2. Mouse pAs identified by 3′READS.
(a) Distribution of PASS reads in the mouse genome (data from all the samples are included). (b) An example gene (Pde3a) showing PASS reads from 3′READS and RNA-seq reads (ENCODE project) used to assign pAs to the gene. (c) Histogram of the length of 3′ end extension for RefSeq mRNA genes (9,612 genes with extension > 0 nt). The median is indicated. (d) Venn diagram comparing pAs in the PolyA_DB 2 database with those identified in this study. (e) Percent of mRNA or lncRNA genes considered to have APA at different isoform relative abundance cutoffs. Numbers of mRNA and lncRNA genes analyzed are indicated.

