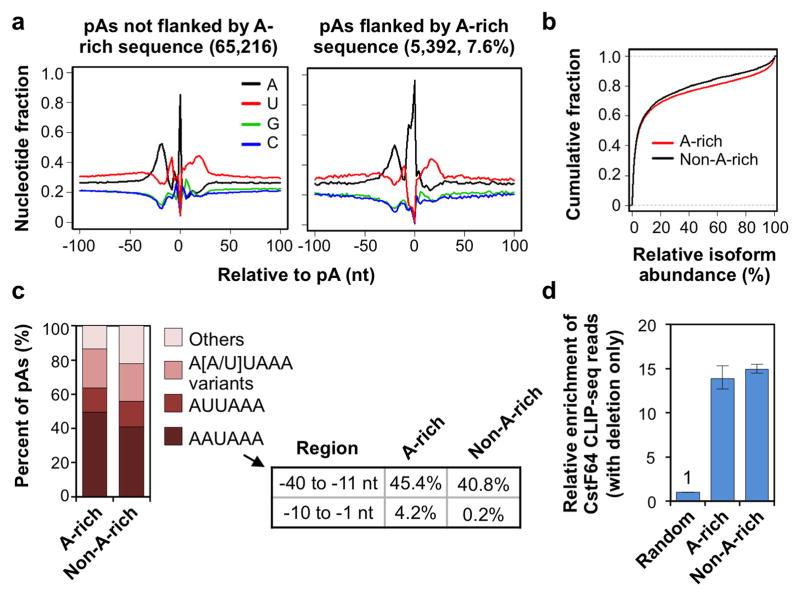
Figure 3. Comparison of pAs flanked by A-rich or non-A-rich sequences.
(a) Nucleotide profile around the pAs identified in this study. Left, pAs not flanked by A-rich sequences; right, pAs flanked by A-rich sequences. (b) Relative abundance of isoforms using pAs flanked by A-rich sequences or other pAs (non-A-rich). The cumulative fraction curves based on all genes analyzed in this study and on all samples combined. (c) PAS distribution in the −40 to −1 nt region for A-rich and non-A-rich pAs. The frequencies of occurrence of AAUAAA in −40 to −11 nt and −10 to −1 nt regions for A-rich and non-A-rich pAs are shown in a table. (d) Enrichment of CstF64 CLIP-seq reads around A-rich or non-A-rich pAs relative to randomly selected gene regions. Error bars represent the 90% confidence interval derived from bootstrapping (1,000 ×) of data.

