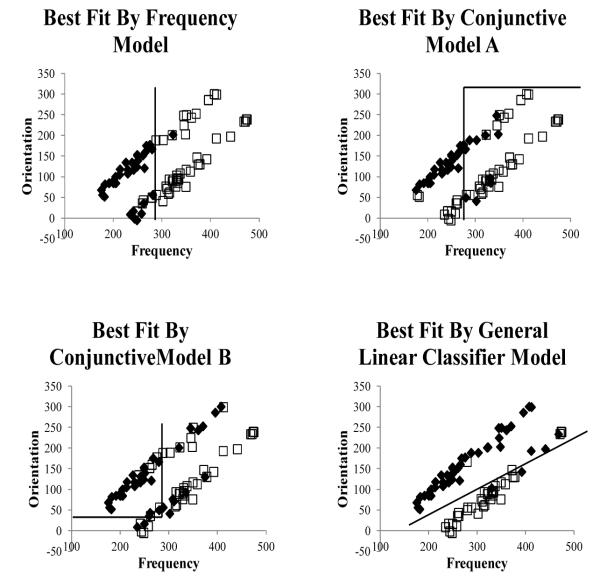
Figure 2.
Response patterns of participants who are best fit by models assuming rule-based or information-integration strategies in the information-integration task. Stimuli that were classified into Category 1are represented by black diamonds and stimuli that were classified into Category 2 are represented by white squares. (a) Responses for a participant whose data were best fit by a frequency rule model. (b) Responses for a participant whose data were best fit by a conjunctive rule model. (c) Responses for a participant whose data were fit by a different type of conjunctive rule model. (d) Responses for participants whose data were best fit by an information-integration model.

