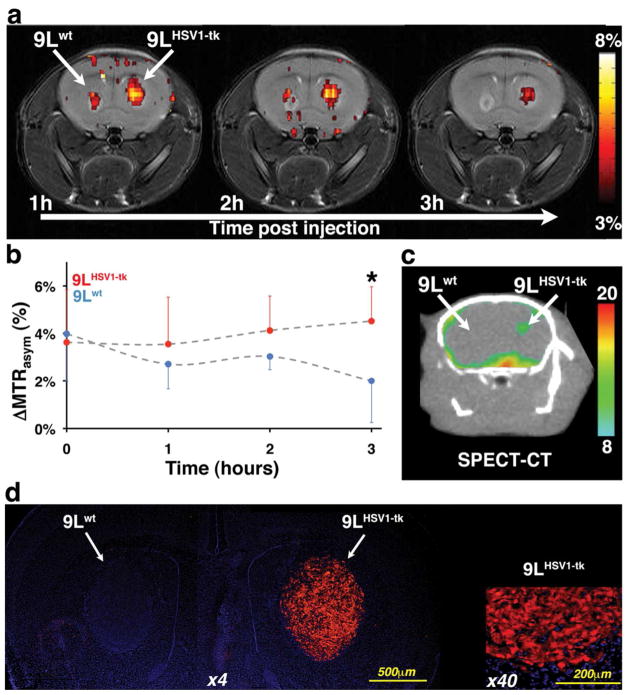
Figure 4. Imaging HSV1-TK expression.
Left hemisphere: wild type 9L tumor (9Lwt); right hemisphere: 9L tumor expressing HSV1-TK (9LHSV1-tk). a) Representative longitudinal in vivo MTRasym (5 ppm) maps of the mouse brain overlaid on T2-weighted images, showing the distribution of 2 obtained one hour, two hours, and three hours after i.v. injection. b) Temporal changes in the ΔMTRasym values (mean ± s.d.) of each tumor type before (n=3) and after (n=8) i.v. administration of 2. (* p-Value<0.01). c) Transverse views of co-registered SPECT-CT images of HSV1-TK expression, obtained three hours after i.v. injection of [125I]FIAU. d) Immunostaining of perfused mouse brain section. Staining for HSV1-TK (anti-V5 antibody in red) overlaid on a DAPI staining (blue) at low (×4) and high (×40) magnifications.

