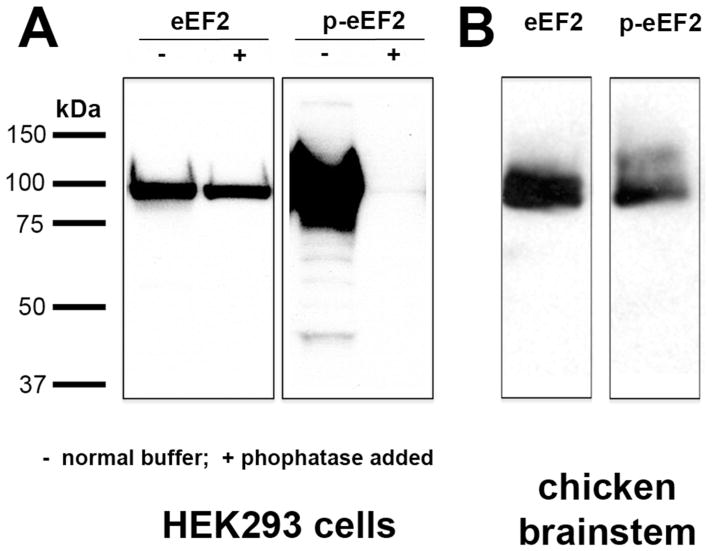
Figure 1.
Western blot assay of anti-eEF2 and anti-p-eEF2 in HEK293 cells (A) and in chick dorsocaudal brainstem (B). Molecular weight standards (left) were used to determine relative sizes of labeled proteins. Anti-eEF2 detects a single band of approximately 95 kDa in both HEK293 cells and chick brainstem regardless of phosphatase treatment. Anti-p-eEF2 detects a single band of the same molecular weight in chick brainstem and HEK293 cells under normal conditions, but is absent in HEK293 cells following phosphatase treatment.

