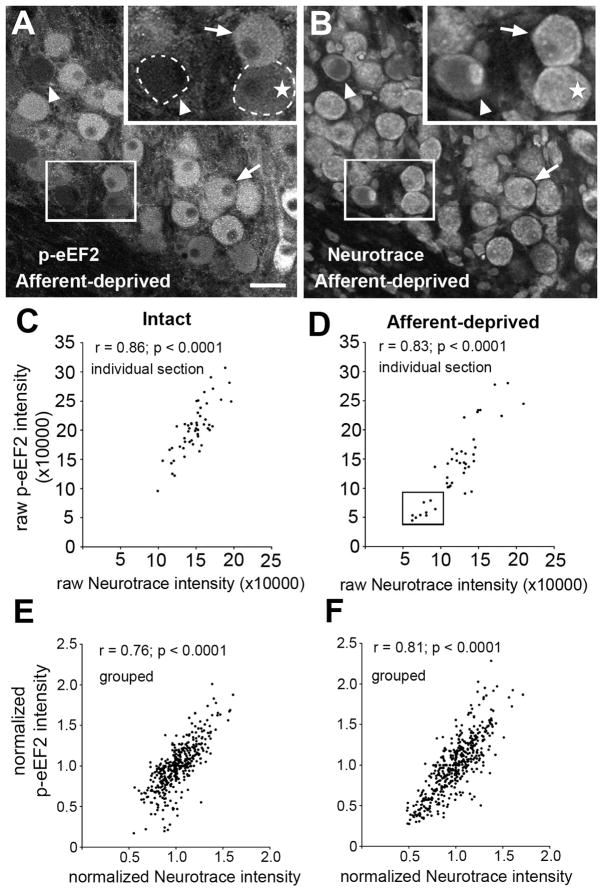
Figure 8.
Correlation of p-eEF2 immunoreactivity with Neurotrace staining in NM neurons at 12h following cochlea removal. A–B: Images of p-eEF2 immunoreactivity (A) and Neurotrace labeling (B) in the same section in the deprived NM at 12h following cochlea removal. Neurons with a lower intensity of p-eEF2 labeling tend to have a lower level of Neurotrace labeling. Arrowheads indicate “ghost neurons” without reliable immunoreactivity for p-eEF2. Arrows indicate neurons with high intensities of both labels. Occasionally, neurons with a low level of p-eEF2 have a high level of Neurotrace staining (stars). Dashed lines outline the border of two lightly labeled neurons. White frames indicate the location of the insert. C–D: Scatter plots from a representative individual animal with unilateral cochlea removal showing integrative p-eEF2 intensity as a function of integrative Neurotrace intensity in intact (C) and afferent-deprived (D) NM neurons from the same section. Note a group of neurons (Box in D) with abnormally low intensities for both labels present in the deprived, but not the intact, NM. E–F: Scatter plots of normalized grouped data; p-eEF2 intensity as a function of normalized Neurotrace intensity in intact (E) or afferent-deprived (F) NM neurons. All cells were combined from multiple sections and animals. Pearson’s correlation coefficient and significance are indicated for each plot. Scale bar is 25 μm in A–B and 12.5 μm in inserts.

