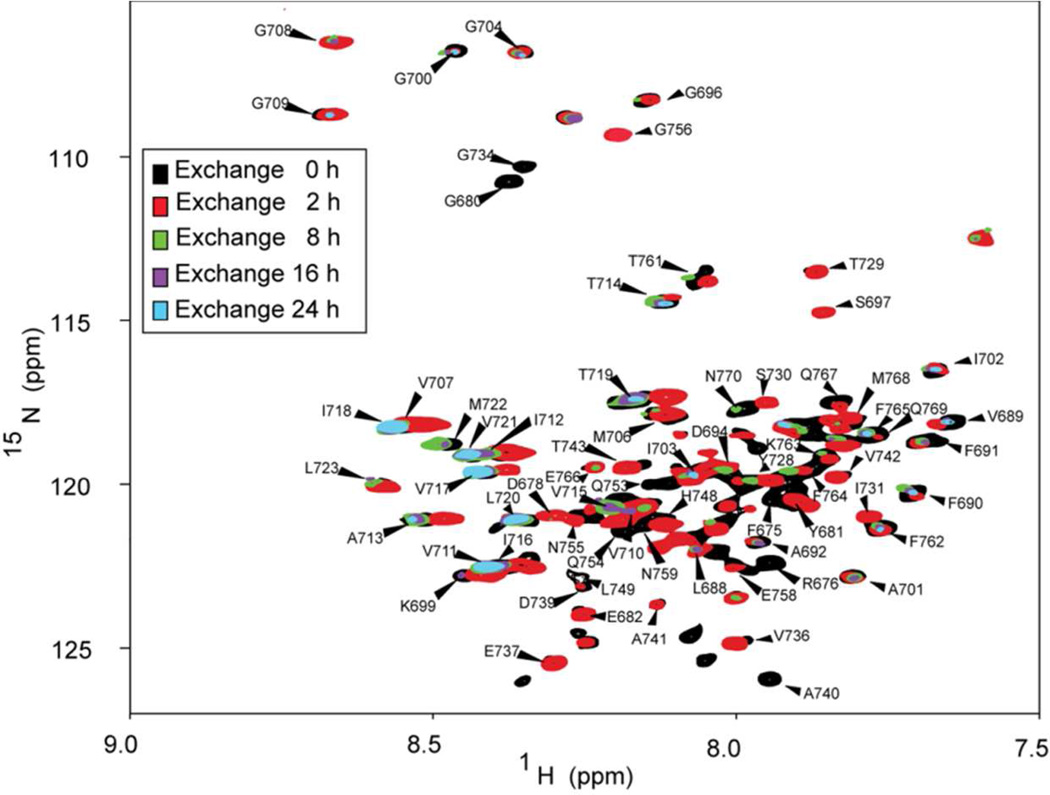
Figure 1. Use of NMR to monitor exchange of C99 backbone amide protons for deuterons as a function of time.
This figure depicts the overlay of five 900 MHz 1H,15N-TROSY NMR spectra of C99, collected at different points of time following dilution of C99 into D2O. The black spectrum shows the reference spectrum collected in an H2O solution. Red, green, purple, and cyan spectra reveal the state of changes after 2, 8, 16, and 24 h, respectively. All NMR resonances that could be accurately assigned are labeled. It should be noted that because each spectrum required 6 h of acquisition time, the actual time reflected by the data is a window spanning the designated time plus 6 h, with the observed spectra being weighted towards the early part of the 6 hour window because of the way the 2-D NMR data is collected (most of the signal is detected in the early increments of the 2D experiment).

