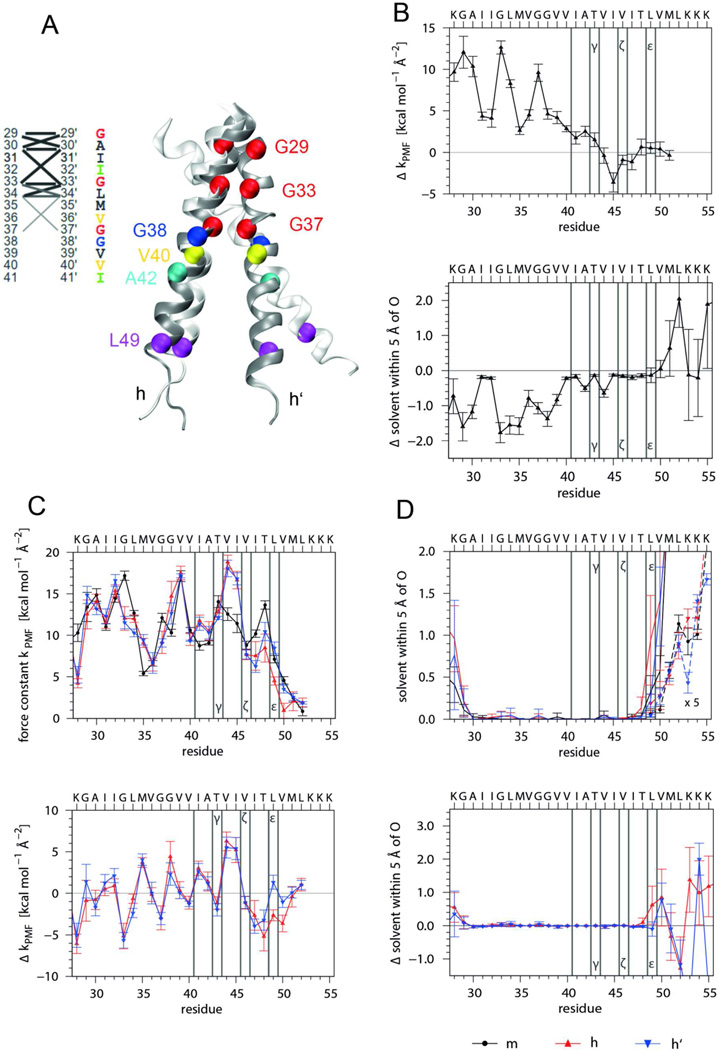
Figure 7. MD simulation of monomeric and dimeric A28-55 in a POPC membrane – comparison to solvent.
A) Comparison of dimer structures in the membrane (dark grey) and in 80% TFE (light grey). The average structure obtained in the membrane was superimposed by a rigid body fit to the Cα atoms of residues 29–37 of helix h of the average structure obtained in TFE. Note that the membrane environment keeps the C-terminal parts of both helices in the dimer closer together. Helix-helix contacts are shown for the membrane (see the legend Fig. 6 A for coding of average Cα-C'α distances). As compared to the helix contacts in TFE (Fig. 6 A) the membrane environment favors a highly symmetric interaction pattern with a unique crossing angle of −40.9 ± 4.2° and a reduced center of mass (COM-COM) distance of 0.68 ± 0.03 nm. The interface is shifted and orients the helices in membrane such that the G29xxxG33 motifs point toward each other (major population: rotation angles α/α’ = −39±19°/ +125±25°; <10% shift to symmetry-related rotation angles α/α’ = +39±18°/ −129±20°). B) Influence of the membrane on helix dynamics and solvation of the monomer as characterized by force constants of intra-helical H-bonds (upper panel, compare Fig. 6 B) and the number of solvent oxygens within 0.5 nm of backbone carbonyl oxygens (lower panel, compare Fig. 6 C). Shown are the differences between mean values in membrane and solvent. Negative values indicate destabilization or desolvation of the TMD in the membrane. Despite the pronounced influence on dynamics, the average structures in both solvents are very similar (the backbone RMSD of core residues equals 0.03 nm). C) Impact of dimerization on helix dynamics in the membrane as characterized by force constants of intra-helical H-bonds (upper panel, m = monomeric helix, h, h’ = helices in the dimer) as well as by the differences between mean dimer and monomer values (lower panel). D) Solvation of helices of monomer and dimer in the membrane as determined by the numbers of solvent (water or TFE) oxygens within 0.5 nm of the backbone carbonyl oxygens (upper panel, values at V50 to K55 are multiplied by a factor of 5) and differences between mean dimer and monomer values (lower panel). Error bars indicate standard deviations calculated from 25 ns block averages. Vertical lines denote cleavage sites.

