
Figure 2. Univariate analysis: Natural log - Admission ICH volume as a function of the BP-based Genetic Risk Score.
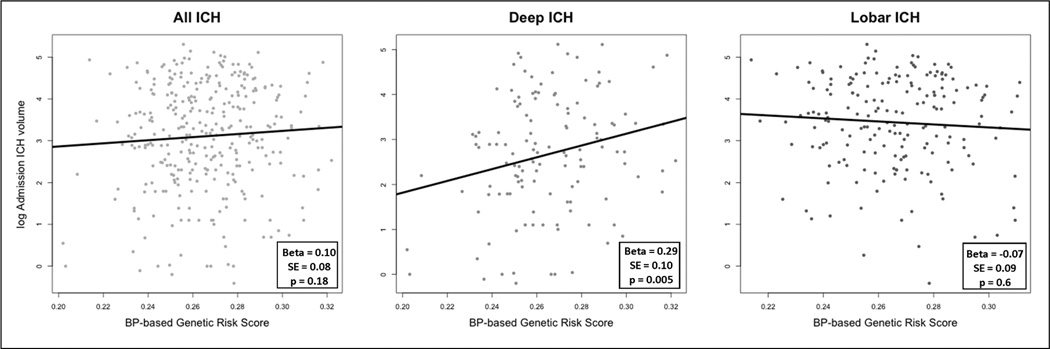
Scatter plot of log-ICH admission volume as a function of the BP-based weighted genetic risk score. Left panel shows deep and lobar ICH combined; central and right panels correspond to deep and lobar hemorrhages, respectively. Each panel also presents the regression line obtained after fitting each model.