
Table 1.
Subject characteristics at baseline
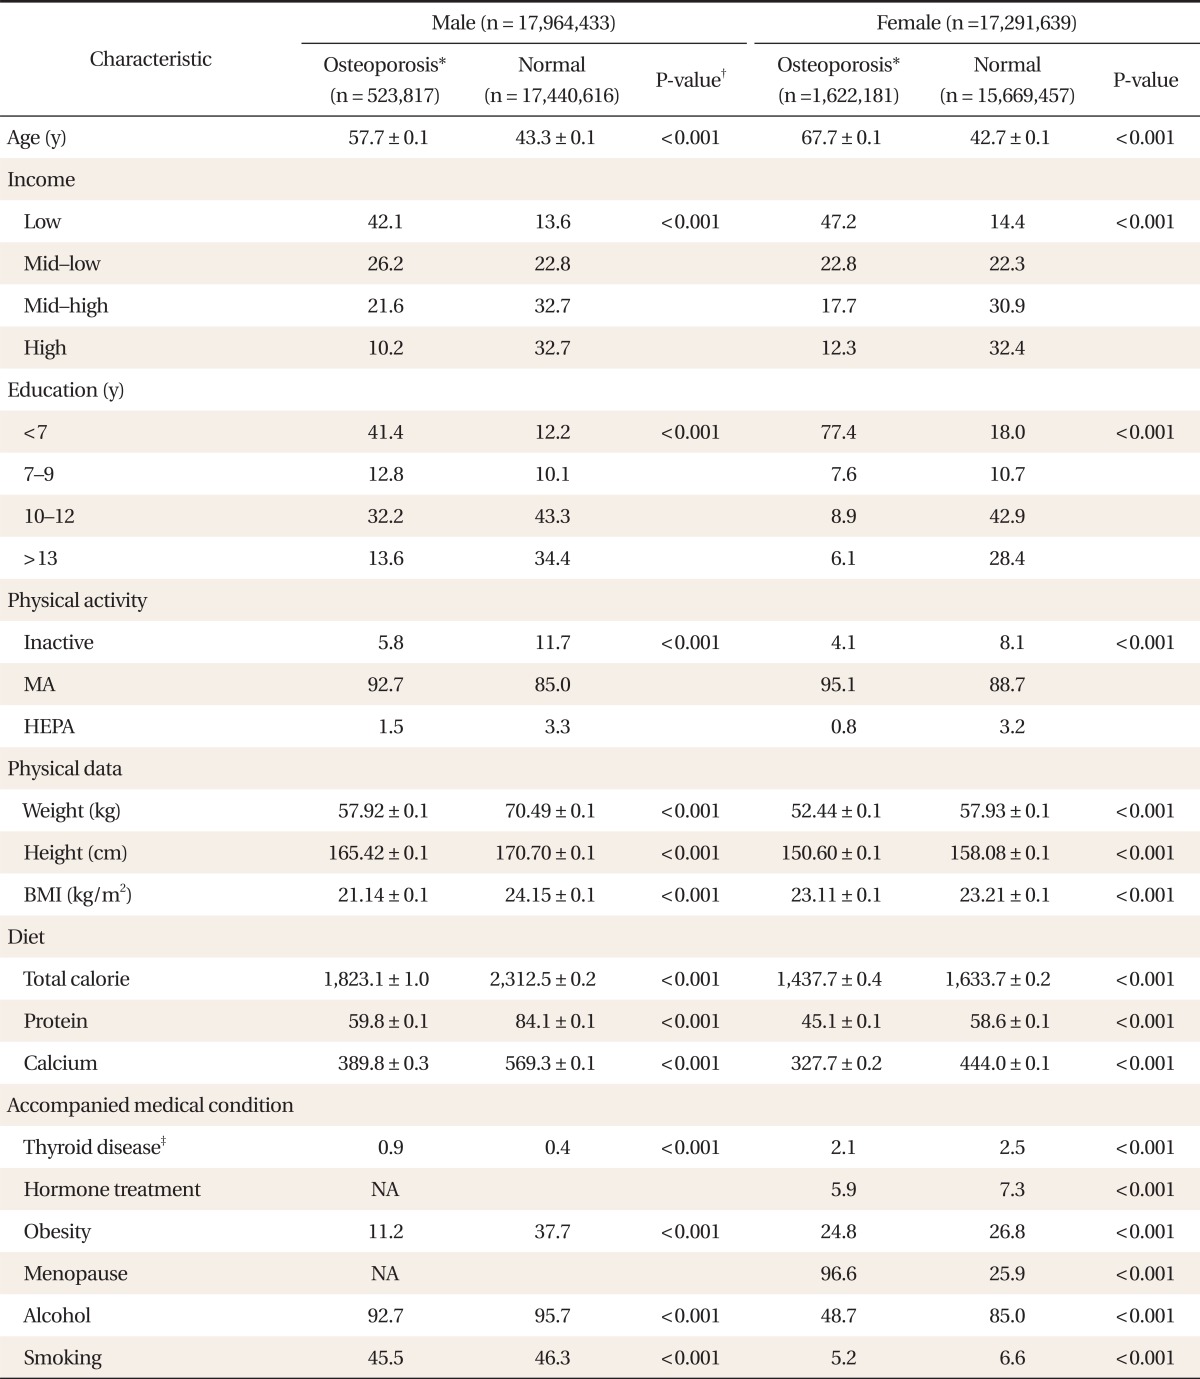
Values are presented as mean ± SD or estimated proportion (%). BMI was calculated as weight in kilograms divided by height in meters squared.
MA: minimally active, HEPA: health enhancing physical activity, BMI: body mass index, NA: not available.
*Lumbar T score ≤ -2.5 was used to classify the normal and osteoporosis groups. †Categorical data were analyzed by Pearson chi-squared test and numerical data were analyzed by two independent sample t-test. ‡Current prevalence of any thyroid disorders.