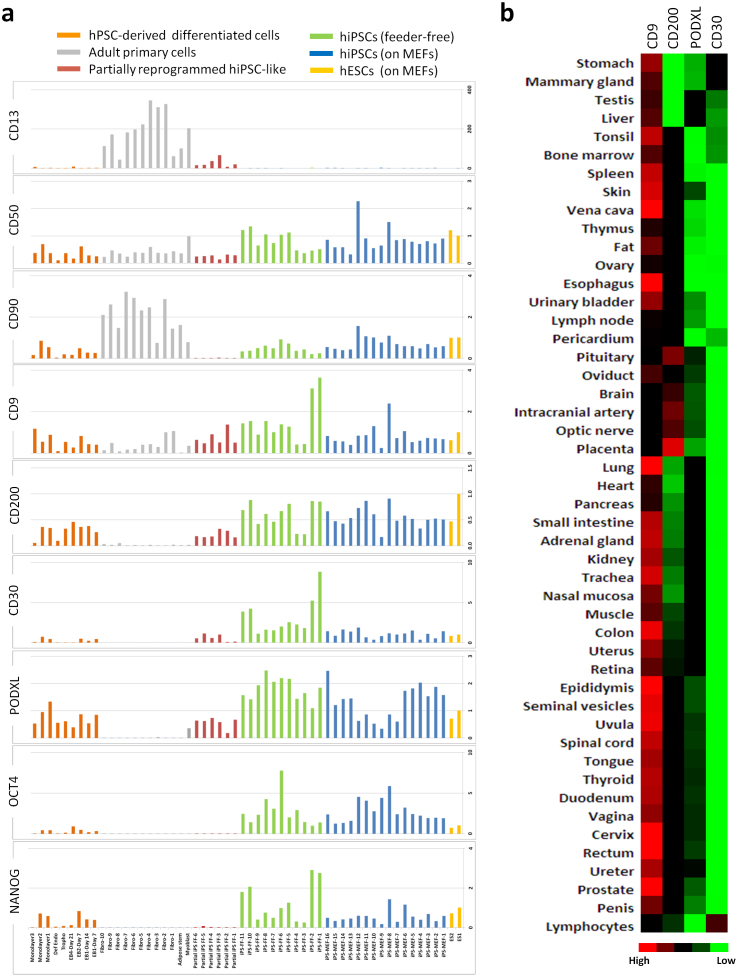
Figure 2. Surface marker expression in hPSCs and somatic cells.
(a) Expression of indicated surface markers was compared to that of NANOG and OCT4 in an array of cell types including hPSCs (hESCs; n = 2, hiPSCs; n = 16) cultured in conventional media and on MEFs, hiPSCs cultured in SMC4 media on Matrigel (n = 11), partially reprogrammed cells cultured in SMC4 media on Matrigel (n = 6), primary adult cells (fibroblasts, n = 10; adipose stem cells, n = 1; myoblasts, n = 1), and hPSC-derived differentiated cells (embryoid bodies, n = 4; definitive endoderm, n = 1; trophectoderm, n = 1; monolayer differentiation, n = 3). Expression of indicated genes was examined by qRT-PCR, and values normalized within each set to that of hESC. (b) Expression of indicated surface markers was examined by qRT-PCR in normal tissue samples (n = 48) and results are depicted as a heat map. Distances between samples and assays are calculated for hierarchical clustering based on the ΔCT values using the Pearson's Correlation. The ΔCT range values are between -3 (High) and 15 (Low).

