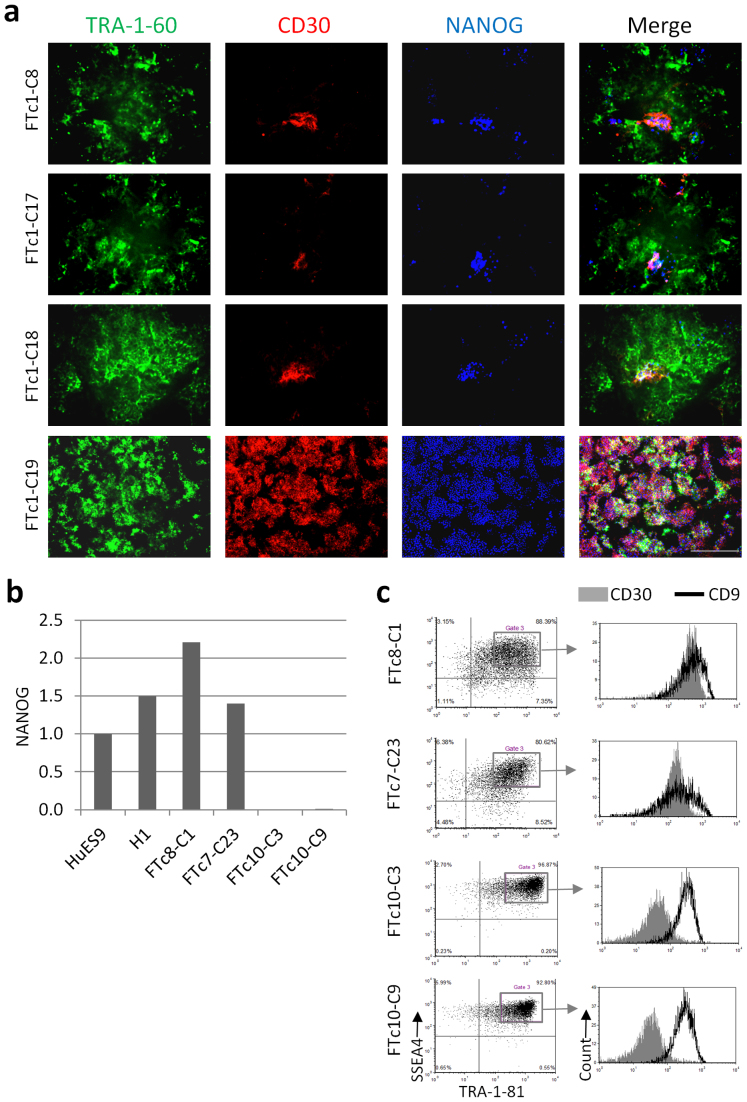
Figure 4. CD30 surface marker correlates with NANOG expression.
(a) Three partially reprogrammed cell lines FTc1-C8, FTc1-C17 and FTc1-C18, and one fully reprogrammed hiPSC line FTc1-c19 were stained for the surface markers TRA-1-60 (green), CD30 (red) and NANOG (blue), and examined under fluorescence microscopy. Scale bar is 200 μm. (b) Four cell lines generated by sorting SSEA4+ TRA-1-81+ cells were analyzed by qRT-PCR for expression of NANOG. (c) The two NANOG+ cell lines FTc8-C1 and FTc7-C23 and the two NANOG− cell lines FTc10-C3 and FTc10-c9 were analyzed by flow cytometry for expression of the surface markers: SSEA4, TRA-1-81, CD30, and CD9. The histograms (right) depict the gated population of cells in the dot plots (left).

