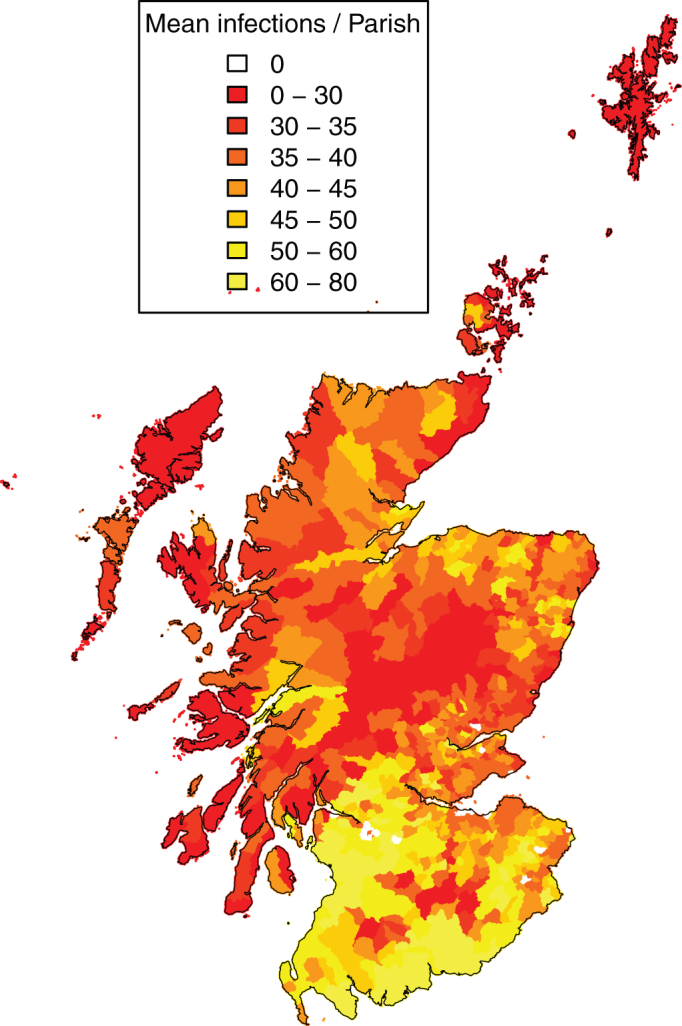
Figure 5. The expected number of infectious bites ( ) resulting from an infected host on the 30th June (day 60) under the extreme case maximum temperature scenario.

This is shown as the parish level mean.
