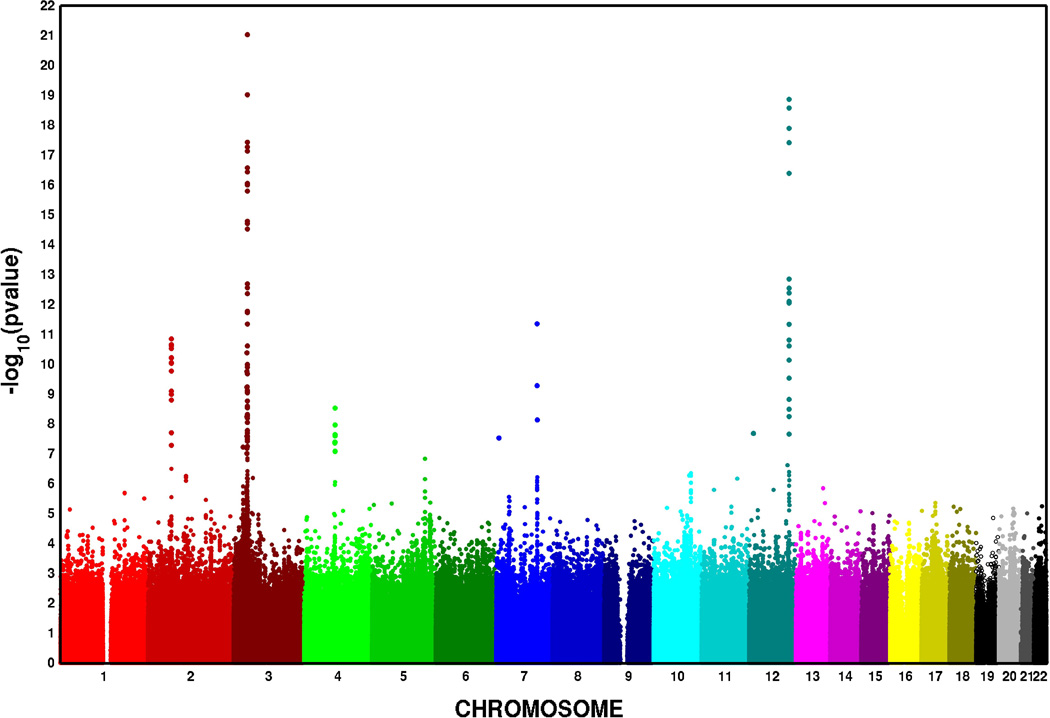
Figure 1.

Manhattan plot of the association of SNPs with PR in a meta-analysis of ten African American cohorts. The x-axis represents the chromosomal position for each SNP, and the y-axis represents the −log10 P-value for association with PR, which is truncated at 1×10⁻²³.
