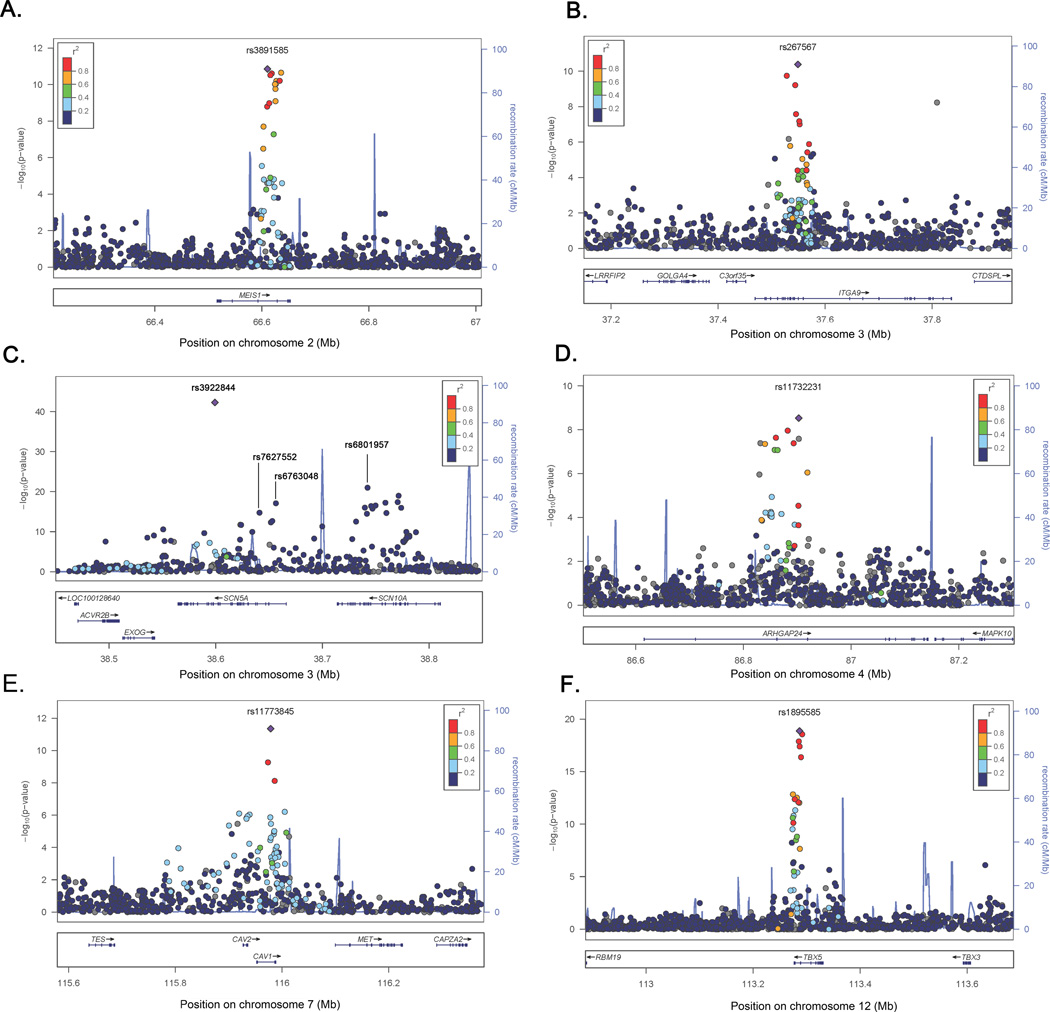
Figure 2.
Regional association plots of six loci associated with PR interval in ten African American cohorts. SNP P-values (represented by circles) at each locus are shown on the −log10(P-value) scale as a function of chromosomal position. Strength of LD is indicated by the color category. Purple diamonds denotes the locus-specific primary signal. Recombination rate is plotted in the background and known genes are shown on the bottom of the plot. A) MEIS1; b) ITGA9; c) SCN5A; d) ARHGAP24; e) CAV1; f) TBX5.

